Free Statistics

of Irreproducible Research!

Author's title

Author*The author of this computation has been verified*
R Software Modulerwasp_autocorrelation.wasp
Title produced by software(Partial) Autocorrelation Function
Date of computationWed, 14 Dec 2016 14:47:46 +0100
Cite this page as followsStatistical Computations at FreeStatistics.org, Office for Research Development and Education, URL https://freestatistics.org/blog/index.php?v=date/2016/Dec/14/t1481723293f1uj84o61sshjgl.htm/, Retrieved Fri, 01 Nov 2024 03:30:52 +0000
Statistical Computations at FreeStatistics.org, Office for Research Development and Education, URL https://freestatistics.org/blog/index.php?pk=299440, Retrieved Fri, 01 Nov 2024 03:30:52 +0000
QR Codes:

Original text written by user:
IsPrivate?No (this computation is public)
User-defined keywords
Estimated Impact83
Family? (F = Feedback message, R = changed R code, M = changed R Module, P = changed Parameters, D = changed Data)
-       [(Partial) Autocorrelation Function] [] [2016-12-14 13:47:46] [2802fcbee976b89d2ab84425d3d65dcf] [Current]
Feedback Forum

Post a new message
Dataseries X:
1439.5
1928.6
2336.6
2956.7
3159.9
3010.2
3795.8
2503.8
2158.6
3148.5
2819.2
3504.1
4132.7
4635.9


Summary of computational transaction
Raw Input view raw input (R code)
Raw Outputview raw output of R engine
Computing time2 seconds
R ServerBig Analytics Cloud Computing Center

\begin{tabular}{lllllllll}
\hline
Summary of computational transaction \tabularnewline
Raw Input view raw input (R code)  \tabularnewline
Raw Outputview raw output of R engine  \tabularnewline
Computing time2 seconds \tabularnewline
R ServerBig Analytics Cloud Computing Center \tabularnewline
\hline
\end{tabular}
%Source: https://freestatistics.org/blog/index.php?pk=299440&T=0

[TABLE]
[ROW]
Summary of computational transaction[/C][/ROW] [ROW]Raw Input[/C] view raw input (R code) [/C][/ROW] [ROW]Raw Output[/C]view raw output of R engine [/C][/ROW] [ROW]Computing time[/C]2 seconds[/C][/ROW] [ROW]R Server[/C]Big Analytics Cloud Computing Center[/C][/ROW] [/TABLE] Source: https://freestatistics.org/blog/index.php?pk=299440&T=0

Globally Unique Identifier (entire table): ba.freestatistics.org/blog/index.php?pk=299440&T=0

As an alternative you can also use a QR Code:  

The GUIDs for individual cells are displayed in the table below:

Summary of computational transaction
Raw Input view raw input (R code)
Raw Outputview raw output of R engine
Computing time2 seconds
R ServerBig Analytics Cloud Computing Center


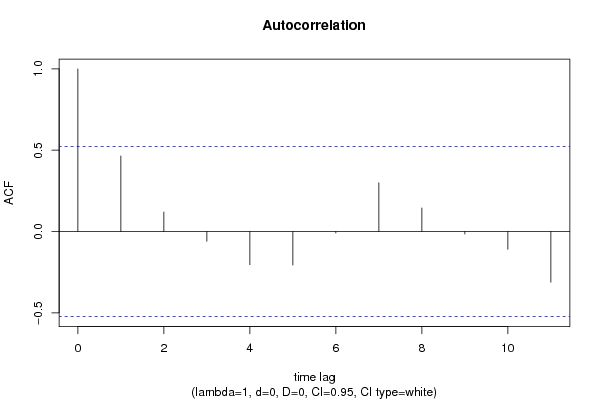
Autocorrelation Function
Time lag kACF(k)T-STATP-value
10.4649421.73970.051924
20.1191310.44570.331297
3-0.060171-0.22510.412562
4-0.203839-0.76270.229151
5-0.206445-0.77240.226347
6-0.009025-0.03380.486769
70.3004151.1240.139948
80.144660.54130.298415
9-0.015389-0.05760.477448
10-0.1096-0.41010.343974
11-0.311701-1.16630.131493

\begin{tabular}{lllllllll}
\hline
Autocorrelation Function \tabularnewline
Time lag k & ACF(k) & T-STAT & P-value \tabularnewline
1 & 0.464942 & 1.7397 & 0.051924 \tabularnewline
2 & 0.119131 & 0.4457 & 0.331297 \tabularnewline
3 & -0.060171 & -0.2251 & 0.412562 \tabularnewline
4 & -0.203839 & -0.7627 & 0.229151 \tabularnewline
5 & -0.206445 & -0.7724 & 0.226347 \tabularnewline
6 & -0.009025 & -0.0338 & 0.486769 \tabularnewline
7 & 0.300415 & 1.124 & 0.139948 \tabularnewline
8 & 0.14466 & 0.5413 & 0.298415 \tabularnewline
9 & -0.015389 & -0.0576 & 0.477448 \tabularnewline
10 & -0.1096 & -0.4101 & 0.343974 \tabularnewline
11 & -0.311701 & -1.1663 & 0.131493 \tabularnewline
\hline
\end{tabular}
%Source: https://freestatistics.org/blog/index.php?pk=299440&T=1

[TABLE]
[ROW][C]Autocorrelation Function[/C][/ROW]
[ROW][C]Time lag k[/C][C]ACF(k)[/C][C]T-STAT[/C][C]P-value[/C][/ROW]
[ROW][C]1[/C][C]0.464942[/C][C]1.7397[/C][C]0.051924[/C][/ROW]
[ROW][C]2[/C][C]0.119131[/C][C]0.4457[/C][C]0.331297[/C][/ROW]
[ROW][C]3[/C][C]-0.060171[/C][C]-0.2251[/C][C]0.412562[/C][/ROW]
[ROW][C]4[/C][C]-0.203839[/C][C]-0.7627[/C][C]0.229151[/C][/ROW]
[ROW][C]5[/C][C]-0.206445[/C][C]-0.7724[/C][C]0.226347[/C][/ROW]
[ROW][C]6[/C][C]-0.009025[/C][C]-0.0338[/C][C]0.486769[/C][/ROW]
[ROW][C]7[/C][C]0.300415[/C][C]1.124[/C][C]0.139948[/C][/ROW]
[ROW][C]8[/C][C]0.14466[/C][C]0.5413[/C][C]0.298415[/C][/ROW]
[ROW][C]9[/C][C]-0.015389[/C][C]-0.0576[/C][C]0.477448[/C][/ROW]
[ROW][C]10[/C][C]-0.1096[/C][C]-0.4101[/C][C]0.343974[/C][/ROW]
[ROW][C]11[/C][C]-0.311701[/C][C]-1.1663[/C][C]0.131493[/C][/ROW]
[/TABLE]
Source: https://freestatistics.org/blog/index.php?pk=299440&T=1

Globally Unique Identifier (entire table): ba.freestatistics.org/blog/index.php?pk=299440&T=1

As an alternative you can also use a QR Code:  

The GUIDs for individual cells are displayed in the table below:

Autocorrelation Function
Time lag kACF(k)T-STATP-value
10.4649421.73970.051924
20.1191310.44570.331297
3-0.060171-0.22510.412562
4-0.203839-0.76270.229151
5-0.206445-0.77240.226347
6-0.009025-0.03380.486769
70.3004151.1240.139948
80.144660.54130.298415
9-0.015389-0.05760.477448
10-0.1096-0.41010.343974
11-0.311701-1.16630.131493


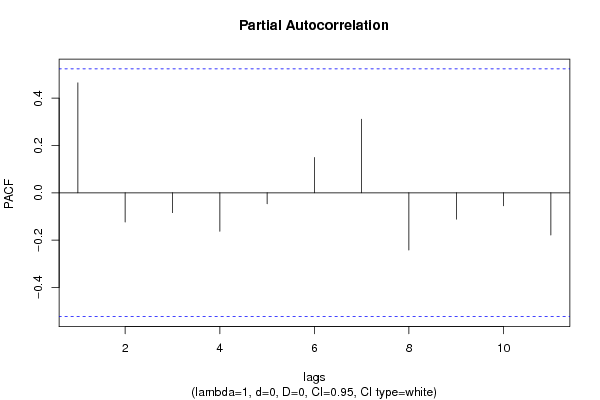
Partial Autocorrelation Function
Time lag kPACF(k)T-STATP-value
10.4649421.73970.051924
2-0.123802-0.46320.325162
3-0.084031-0.31440.378921
4-0.162375-0.60760.276606
5-0.046677-0.17460.431928
60.1495370.55950.292326
70.3109871.16360.132016
8-0.242136-0.9060.190135
9-0.111353-0.41660.341628
10-0.054949-0.20560.420031
11-0.178545-0.66810.257482

\begin{tabular}{lllllllll}
\hline
Partial Autocorrelation Function \tabularnewline
Time lag k & PACF(k) & T-STAT & P-value \tabularnewline
1 & 0.464942 & 1.7397 & 0.051924 \tabularnewline
2 & -0.123802 & -0.4632 & 0.325162 \tabularnewline
3 & -0.084031 & -0.3144 & 0.378921 \tabularnewline
4 & -0.162375 & -0.6076 & 0.276606 \tabularnewline
5 & -0.046677 & -0.1746 & 0.431928 \tabularnewline
6 & 0.149537 & 0.5595 & 0.292326 \tabularnewline
7 & 0.310987 & 1.1636 & 0.132016 \tabularnewline
8 & -0.242136 & -0.906 & 0.190135 \tabularnewline
9 & -0.111353 & -0.4166 & 0.341628 \tabularnewline
10 & -0.054949 & -0.2056 & 0.420031 \tabularnewline
11 & -0.178545 & -0.6681 & 0.257482 \tabularnewline
\hline
\end{tabular}
%Source: https://freestatistics.org/blog/index.php?pk=299440&T=2

[TABLE]
[ROW][C]Partial Autocorrelation Function[/C][/ROW]
[ROW][C]Time lag k[/C][C]PACF(k)[/C][C]T-STAT[/C][C]P-value[/C][/ROW]
[ROW][C]1[/C][C]0.464942[/C][C]1.7397[/C][C]0.051924[/C][/ROW]
[ROW][C]2[/C][C]-0.123802[/C][C]-0.4632[/C][C]0.325162[/C][/ROW]
[ROW][C]3[/C][C]-0.084031[/C][C]-0.3144[/C][C]0.378921[/C][/ROW]
[ROW][C]4[/C][C]-0.162375[/C][C]-0.6076[/C][C]0.276606[/C][/ROW]
[ROW][C]5[/C][C]-0.046677[/C][C]-0.1746[/C][C]0.431928[/C][/ROW]
[ROW][C]6[/C][C]0.149537[/C][C]0.5595[/C][C]0.292326[/C][/ROW]
[ROW][C]7[/C][C]0.310987[/C][C]1.1636[/C][C]0.132016[/C][/ROW]
[ROW][C]8[/C][C]-0.242136[/C][C]-0.906[/C][C]0.190135[/C][/ROW]
[ROW][C]9[/C][C]-0.111353[/C][C]-0.4166[/C][C]0.341628[/C][/ROW]
[ROW][C]10[/C][C]-0.054949[/C][C]-0.2056[/C][C]0.420031[/C][/ROW]
[ROW][C]11[/C][C]-0.178545[/C][C]-0.6681[/C][C]0.257482[/C][/ROW]
[/TABLE]
Source: https://freestatistics.org/blog/index.php?pk=299440&T=2

Globally Unique Identifier (entire table): ba.freestatistics.org/blog/index.php?pk=299440&T=2

As an alternative you can also use a QR Code:  

The GUIDs for individual cells are displayed in the table below:

Partial Autocorrelation Function
Time lag kPACF(k)T-STATP-value
10.4649421.73970.051924
2-0.123802-0.46320.325162
3-0.084031-0.31440.378921
4-0.162375-0.60760.276606
5-0.046677-0.17460.431928
60.1495370.55950.292326
70.3109871.16360.132016
8-0.242136-0.9060.190135
9-0.111353-0.41660.341628
10-0.054949-0.20560.420031
11-0.178545-0.66810.257482


Parameters (Session):
par1 = Default ; par2 = 1 ; par3 = 0 ; par4 = 0 ; par5 = 12 ; par6 = White Noise ; par7 = 0.95 ;
Parameters (R input):
par1 = Default ; par2 = 1 ; par3 = 0 ; par4 = 0 ; par5 = 12 ; par6 = White Noise ; par7 = 0.95 ; par8 = ;
R code (references can be found in the software module):
if (par1 == 'Default') {
par1 = 10*log10(length(x))
} else {
par1 <- as.numeric(par1)
}
par2 <- as.numeric(par2)
par3 <- as.numeric(par3)
par4 <- as.numeric(par4)
par5 <- as.numeric(par5)
if (par6 == 'White Noise') par6 <- 'white' else par6 <- 'ma'
par7 <- as.numeric(par7)
if (par8 != '') par8 <- as.numeric(par8)
x <- na.omit(x)
ox <- x
if (par8 == '') {
if (par2 == 0) {
x <- log(x)
} else {
x <- (x ^ par2 - 1) / par2
}
} else {
x <- log(x,base=par8)
}
if (par3 > 0) x <- diff(x,lag=1,difference=par3)
if (par4 > 0) x <- diff(x,lag=par5,difference=par4)
bitmap(file='picts.png')
op <- par(mfrow=c(2,1))
plot(ox,type='l',main='Original Time Series',xlab='time',ylab='value')
if (par8=='') {
mytitle <- paste('Working Time Series (lambda=',par2,', d=',par3,', D=',par4,')',sep='')
mysub <- paste('(lambda=',par2,', d=',par3,', D=',par4,', CI=', par7, ', CI type=',par6,')',sep='')
} else {
mytitle <- paste('Working Time Series (base=',par8,', d=',par3,', D=',par4,')',sep='')
mysub <- paste('(base=',par8,', d=',par3,', D=',par4,', CI=', par7, ', CI type=',par6,')',sep='')
}
plot(x,type='l', main=mytitle,xlab='time',ylab='value')
par(op)
dev.off()
bitmap(file='pic1.png')
racf <- acf(x, par1, main='Autocorrelation', xlab='time lag', ylab='ACF', ci.type=par6, ci=par7, sub=mysub)
dev.off()
bitmap(file='pic2.png')
rpacf <- pacf(x,par1,main='Partial Autocorrelation',xlab='lags',ylab='PACF',sub=mysub)
dev.off()
(myacf <- c(racf$acf))
(mypacf <- c(rpacf$acf))
lengthx <- length(x)
sqrtn <- sqrt(lengthx)
load(file='createtable')
a<-table.start()
a<-table.row.start(a)
a<-table.element(a,'Autocorrelation Function',4,TRUE)
a<-table.row.end(a)
a<-table.row.start(a)
a<-table.element(a,'Time lag k',header=TRUE)
a<-table.element(a,'ACF(k)',header=TRUE)
a<-table.element(a,'T-STAT',header=TRUE)
a<-table.element(a,'P-value',header=TRUE)
a<-table.row.end(a)
for (i in 2:(par1+1)) {
a<-table.row.start(a)
a<-table.element(a,i-1,header=TRUE)
a<-table.element(a,round(myacf[i],6))
mytstat <- myacf[i]*sqrtn
a<-table.element(a,round(mytstat,4))
a<-table.element(a,round(1-pt(abs(mytstat),lengthx),6))
a<-table.row.end(a)
}
a<-table.end(a)
table.save(a,file='mytable.tab')
a<-table.start()
a<-table.row.start(a)
a<-table.element(a,'Partial Autocorrelation Function',4,TRUE)
a<-table.row.end(a)
a<-table.row.start(a)
a<-table.element(a,'Time lag k',header=TRUE)
a<-table.element(a,'PACF(k)',header=TRUE)
a<-table.element(a,'T-STAT',header=TRUE)
a<-table.element(a,'P-value',header=TRUE)
a<-table.row.end(a)
for (i in 1:par1) {
a<-table.row.start(a)
a<-table.element(a,i,header=TRUE)
a<-table.element(a,round(mypacf[i],6))
mytstat <- mypacf[i]*sqrtn
a<-table.element(a,round(mytstat,4))
a<-table.element(a,round(1-pt(abs(mytstat),lengthx),6))
a<-table.row.end(a)
}
a<-table.end(a)
table.save(a,file='mytable1.tab')