Free Statistics

of Irreproducible Research!

Author's title

Author*The author of this computation has been verified*
R Software Modulerwasp_decompose.wasp
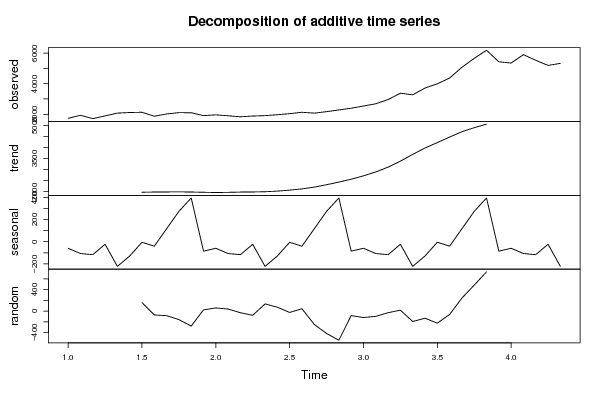
Title produced by softwareClassical Decomposition
Date of computationMon, 12 Dec 2016 19:38:49 +0100
Cite this page as followsStatistical Computations at FreeStatistics.org, Office for Research Development and Education, URL https://freestatistics.org/blog/index.php?v=date/2016/Dec/12/t1481567945p12itr4dk0j6lrd.htm/, Retrieved Fri, 01 Nov 2024 03:32:21 +0000
Statistical Computations at FreeStatistics.org, Office for Research Development and Education, URL https://freestatistics.org/blog/index.php?pk=298959, Retrieved Fri, 01 Nov 2024 03:32:21 +0000
QR Codes:

Original text written by user:
IsPrivate?No (this computation is public)
User-defined keywords
Estimated Impact109
Family? (F = Feedback message, R = changed R code, M = changed R Module, P = changed Parameters, D = changed Data)
-       [Classical Decomposition] [classical decompo...] [2016-12-12 18:38:49] [130d73899007e5ff8a4f636b9bcfb397] [Current]
Feedback Forum

Post a new message
Dataseries X:
1737.4
1934.4
1716
1894.6
2078.4
2116.4
2132.8
1874.2
2021.4
2109
2101.2
1913
1965
1903.4
1837.4
1888
1912
1971.4
2041.6
2132.2
2075.4
2172
2284.6
2396.4
2539.4
2688
2964.2
3375.6
3271.4
3714.8
3989.4
4367.2
5070.4
5651.6
6180.8
5428.6
5346.4
5891.8
5527
5191.4
5324.6


Summary of computational transaction
Raw Input view raw input (R code)
Raw Outputview raw output of R engine
Computing time1 seconds
R ServerBig Analytics Cloud Computing Center

\begin{tabular}{lllllllll}
\hline
Summary of computational transaction \tabularnewline
Raw Input view raw input (R code)  \tabularnewline
Raw Outputview raw output of R engine  \tabularnewline
Computing time1 seconds \tabularnewline
R ServerBig Analytics Cloud Computing Center \tabularnewline
\hline
\end{tabular}
%Source: https://freestatistics.org/blog/index.php?pk=298959&T=0

[TABLE]
[ROW]
Summary of computational transaction[/C][/ROW] [ROW]Raw Input[/C] view raw input (R code) [/C][/ROW] [ROW]Raw Output[/C]view raw output of R engine [/C][/ROW] [ROW]Computing time[/C]1 seconds[/C][/ROW] [ROW]R Server[/C]Big Analytics Cloud Computing Center[/C][/ROW] [/TABLE] Source: https://freestatistics.org/blog/index.php?pk=298959&T=0

Globally Unique Identifier (entire table): ba.freestatistics.org/blog/index.php?pk=298959&T=0

As an alternative you can also use a QR Code:  

The GUIDs for individual cells are displayed in the table below:

Summary of computational transaction
Raw Input view raw input (R code)
Raw Outputview raw output of R engine
Computing time1 seconds
R ServerBig Analytics Cloud Computing Center


Classical Decomposition by Moving Averages
tObservationsFitTrendSeasonalRandom
11737.4NANA-58.9553NA
21934.4NANA-106.072NA
31716NANA-116.43NA
41894.6NANA-22.7553NA
52078.4NANA-221.651NA
62116.4NANA-128.484NA
72132.81973.81978.55-4.75116159.001
81874.21946.831986.74-39.9067-72.635
92021.42107.241990.51116.732-85.8405
1021092268.441995.29273.146-159.438
112101.22381.691988.08393.604-280.488
1219131890.631975.11-84.476222.3678
1319651906.311965.27-58.955358.6887
141903.41866.141972.22-106.07237.2553
151837.41868.791985.22-116.43-31.3863
1618881967.341990.09-22.7553-79.3363
1719121778.712000.36-221.651133.293
181971.41899.662028.14-128.48471.7428
192041.62067.472072.22-4.75116-25.8655
202132.22088.932128.84-39.906743.265
212075.42325.222208.48116.732-249.816
2221722590.562317.42273.146-418.563
232284.62829.652436.04393.604-545.046
242396.42480.852565.33-84.4762-84.4488
252539.42660.172719.12-58.9553-120.77
2626882787.342893.41-106.072-99.3363
272964.22994.893111.32-116.43-30.6947
283375.63358.343381.1-22.755317.2553
293271.43466.773688.42-221.651-195.374
303714.83848.623977.11-128.484-133.824
313989.44215.664220.41-4.75116-226.257
324367.24430.954470.86-39.9067-63.7516
335070.44827.874711.13116.732242.534
345651.65166.724893.58273.146484.879
356180.85448.395054.78393.604732.412
365428.6NANA-84.4762NA
375346.4NANA-58.9553NA
385891.8NANA-106.072NA
395527NANA-116.43NA
405191.4NANA-22.7553NA
415324.6NANA-221.651NA

\begin{tabular}{lllllllll}
\hline
Classical Decomposition by Moving Averages \tabularnewline
t & Observations & Fit & Trend & Seasonal & Random \tabularnewline
1 & 1737.4 & NA & NA & -58.9553 & NA \tabularnewline
2 & 1934.4 & NA & NA & -106.072 & NA \tabularnewline
3 & 1716 & NA & NA & -116.43 & NA \tabularnewline
4 & 1894.6 & NA & NA & -22.7553 & NA \tabularnewline
5 & 2078.4 & NA & NA & -221.651 & NA \tabularnewline
6 & 2116.4 & NA & NA & -128.484 & NA \tabularnewline
7 & 2132.8 & 1973.8 & 1978.55 & -4.75116 & 159.001 \tabularnewline
8 & 1874.2 & 1946.83 & 1986.74 & -39.9067 & -72.635 \tabularnewline
9 & 2021.4 & 2107.24 & 1990.51 & 116.732 & -85.8405 \tabularnewline
10 & 2109 & 2268.44 & 1995.29 & 273.146 & -159.438 \tabularnewline
11 & 2101.2 & 2381.69 & 1988.08 & 393.604 & -280.488 \tabularnewline
12 & 1913 & 1890.63 & 1975.11 & -84.4762 & 22.3678 \tabularnewline
13 & 1965 & 1906.31 & 1965.27 & -58.9553 & 58.6887 \tabularnewline
14 & 1903.4 & 1866.14 & 1972.22 & -106.072 & 37.2553 \tabularnewline
15 & 1837.4 & 1868.79 & 1985.22 & -116.43 & -31.3863 \tabularnewline
16 & 1888 & 1967.34 & 1990.09 & -22.7553 & -79.3363 \tabularnewline
17 & 1912 & 1778.71 & 2000.36 & -221.651 & 133.293 \tabularnewline
18 & 1971.4 & 1899.66 & 2028.14 & -128.484 & 71.7428 \tabularnewline
19 & 2041.6 & 2067.47 & 2072.22 & -4.75116 & -25.8655 \tabularnewline
20 & 2132.2 & 2088.93 & 2128.84 & -39.9067 & 43.265 \tabularnewline
21 & 2075.4 & 2325.22 & 2208.48 & 116.732 & -249.816 \tabularnewline
22 & 2172 & 2590.56 & 2317.42 & 273.146 & -418.563 \tabularnewline
23 & 2284.6 & 2829.65 & 2436.04 & 393.604 & -545.046 \tabularnewline
24 & 2396.4 & 2480.85 & 2565.33 & -84.4762 & -84.4488 \tabularnewline
25 & 2539.4 & 2660.17 & 2719.12 & -58.9553 & -120.77 \tabularnewline
26 & 2688 & 2787.34 & 2893.41 & -106.072 & -99.3363 \tabularnewline
27 & 2964.2 & 2994.89 & 3111.32 & -116.43 & -30.6947 \tabularnewline
28 & 3375.6 & 3358.34 & 3381.1 & -22.7553 & 17.2553 \tabularnewline
29 & 3271.4 & 3466.77 & 3688.42 & -221.651 & -195.374 \tabularnewline
30 & 3714.8 & 3848.62 & 3977.11 & -128.484 & -133.824 \tabularnewline
31 & 3989.4 & 4215.66 & 4220.41 & -4.75116 & -226.257 \tabularnewline
32 & 4367.2 & 4430.95 & 4470.86 & -39.9067 & -63.7516 \tabularnewline
33 & 5070.4 & 4827.87 & 4711.13 & 116.732 & 242.534 \tabularnewline
34 & 5651.6 & 5166.72 & 4893.58 & 273.146 & 484.879 \tabularnewline
35 & 6180.8 & 5448.39 & 5054.78 & 393.604 & 732.412 \tabularnewline
36 & 5428.6 & NA & NA & -84.4762 & NA \tabularnewline
37 & 5346.4 & NA & NA & -58.9553 & NA \tabularnewline
38 & 5891.8 & NA & NA & -106.072 & NA \tabularnewline
39 & 5527 & NA & NA & -116.43 & NA \tabularnewline
40 & 5191.4 & NA & NA & -22.7553 & NA \tabularnewline
41 & 5324.6 & NA & NA & -221.651 & NA \tabularnewline
\hline
\end{tabular}
%Source: https://freestatistics.org/blog/index.php?pk=298959&T=1

[TABLE]
[ROW][C]Classical Decomposition by Moving Averages[/C][/ROW]
[ROW][C]t[/C][C]Observations[/C][C]Fit[/C][C]Trend[/C][C]Seasonal[/C][C]Random[/C][/ROW]
[ROW][C]1[/C][C]1737.4[/C][C]NA[/C][C]NA[/C][C]-58.9553[/C][C]NA[/C][/ROW]
[ROW][C]2[/C][C]1934.4[/C][C]NA[/C][C]NA[/C][C]-106.072[/C][C]NA[/C][/ROW]
[ROW][C]3[/C][C]1716[/C][C]NA[/C][C]NA[/C][C]-116.43[/C][C]NA[/C][/ROW]
[ROW][C]4[/C][C]1894.6[/C][C]NA[/C][C]NA[/C][C]-22.7553[/C][C]NA[/C][/ROW]
[ROW][C]5[/C][C]2078.4[/C][C]NA[/C][C]NA[/C][C]-221.651[/C][C]NA[/C][/ROW]
[ROW][C]6[/C][C]2116.4[/C][C]NA[/C][C]NA[/C][C]-128.484[/C][C]NA[/C][/ROW]
[ROW][C]7[/C][C]2132.8[/C][C]1973.8[/C][C]1978.55[/C][C]-4.75116[/C][C]159.001[/C][/ROW]
[ROW][C]8[/C][C]1874.2[/C][C]1946.83[/C][C]1986.74[/C][C]-39.9067[/C][C]-72.635[/C][/ROW]
[ROW][C]9[/C][C]2021.4[/C][C]2107.24[/C][C]1990.51[/C][C]116.732[/C][C]-85.8405[/C][/ROW]
[ROW][C]10[/C][C]2109[/C][C]2268.44[/C][C]1995.29[/C][C]273.146[/C][C]-159.438[/C][/ROW]
[ROW][C]11[/C][C]2101.2[/C][C]2381.69[/C][C]1988.08[/C][C]393.604[/C][C]-280.488[/C][/ROW]
[ROW][C]12[/C][C]1913[/C][C]1890.63[/C][C]1975.11[/C][C]-84.4762[/C][C]22.3678[/C][/ROW]
[ROW][C]13[/C][C]1965[/C][C]1906.31[/C][C]1965.27[/C][C]-58.9553[/C][C]58.6887[/C][/ROW]
[ROW][C]14[/C][C]1903.4[/C][C]1866.14[/C][C]1972.22[/C][C]-106.072[/C][C]37.2553[/C][/ROW]
[ROW][C]15[/C][C]1837.4[/C][C]1868.79[/C][C]1985.22[/C][C]-116.43[/C][C]-31.3863[/C][/ROW]
[ROW][C]16[/C][C]1888[/C][C]1967.34[/C][C]1990.09[/C][C]-22.7553[/C][C]-79.3363[/C][/ROW]
[ROW][C]17[/C][C]1912[/C][C]1778.71[/C][C]2000.36[/C][C]-221.651[/C][C]133.293[/C][/ROW]
[ROW][C]18[/C][C]1971.4[/C][C]1899.66[/C][C]2028.14[/C][C]-128.484[/C][C]71.7428[/C][/ROW]
[ROW][C]19[/C][C]2041.6[/C][C]2067.47[/C][C]2072.22[/C][C]-4.75116[/C][C]-25.8655[/C][/ROW]
[ROW][C]20[/C][C]2132.2[/C][C]2088.93[/C][C]2128.84[/C][C]-39.9067[/C][C]43.265[/C][/ROW]
[ROW][C]21[/C][C]2075.4[/C][C]2325.22[/C][C]2208.48[/C][C]116.732[/C][C]-249.816[/C][/ROW]
[ROW][C]22[/C][C]2172[/C][C]2590.56[/C][C]2317.42[/C][C]273.146[/C][C]-418.563[/C][/ROW]
[ROW][C]23[/C][C]2284.6[/C][C]2829.65[/C][C]2436.04[/C][C]393.604[/C][C]-545.046[/C][/ROW]
[ROW][C]24[/C][C]2396.4[/C][C]2480.85[/C][C]2565.33[/C][C]-84.4762[/C][C]-84.4488[/C][/ROW]
[ROW][C]25[/C][C]2539.4[/C][C]2660.17[/C][C]2719.12[/C][C]-58.9553[/C][C]-120.77[/C][/ROW]
[ROW][C]26[/C][C]2688[/C][C]2787.34[/C][C]2893.41[/C][C]-106.072[/C][C]-99.3363[/C][/ROW]
[ROW][C]27[/C][C]2964.2[/C][C]2994.89[/C][C]3111.32[/C][C]-116.43[/C][C]-30.6947[/C][/ROW]
[ROW][C]28[/C][C]3375.6[/C][C]3358.34[/C][C]3381.1[/C][C]-22.7553[/C][C]17.2553[/C][/ROW]
[ROW][C]29[/C][C]3271.4[/C][C]3466.77[/C][C]3688.42[/C][C]-221.651[/C][C]-195.374[/C][/ROW]
[ROW][C]30[/C][C]3714.8[/C][C]3848.62[/C][C]3977.11[/C][C]-128.484[/C][C]-133.824[/C][/ROW]
[ROW][C]31[/C][C]3989.4[/C][C]4215.66[/C][C]4220.41[/C][C]-4.75116[/C][C]-226.257[/C][/ROW]
[ROW][C]32[/C][C]4367.2[/C][C]4430.95[/C][C]4470.86[/C][C]-39.9067[/C][C]-63.7516[/C][/ROW]
[ROW][C]33[/C][C]5070.4[/C][C]4827.87[/C][C]4711.13[/C][C]116.732[/C][C]242.534[/C][/ROW]
[ROW][C]34[/C][C]5651.6[/C][C]5166.72[/C][C]4893.58[/C][C]273.146[/C][C]484.879[/C][/ROW]
[ROW][C]35[/C][C]6180.8[/C][C]5448.39[/C][C]5054.78[/C][C]393.604[/C][C]732.412[/C][/ROW]
[ROW][C]36[/C][C]5428.6[/C][C]NA[/C][C]NA[/C][C]-84.4762[/C][C]NA[/C][/ROW]
[ROW][C]37[/C][C]5346.4[/C][C]NA[/C][C]NA[/C][C]-58.9553[/C][C]NA[/C][/ROW]
[ROW][C]38[/C][C]5891.8[/C][C]NA[/C][C]NA[/C][C]-106.072[/C][C]NA[/C][/ROW]
[ROW][C]39[/C][C]5527[/C][C]NA[/C][C]NA[/C][C]-116.43[/C][C]NA[/C][/ROW]
[ROW][C]40[/C][C]5191.4[/C][C]NA[/C][C]NA[/C][C]-22.7553[/C][C]NA[/C][/ROW]
[ROW][C]41[/C][C]5324.6[/C][C]NA[/C][C]NA[/C][C]-221.651[/C][C]NA[/C][/ROW]
[/TABLE]
Source: https://freestatistics.org/blog/index.php?pk=298959&T=1

Globally Unique Identifier (entire table): ba.freestatistics.org/blog/index.php?pk=298959&T=1

As an alternative you can also use a QR Code:  

The GUIDs for individual cells are displayed in the table below:

Classical Decomposition by Moving Averages
tObservationsFitTrendSeasonalRandom
11737.4NANA-58.9553NA
21934.4NANA-106.072NA
31716NANA-116.43NA
41894.6NANA-22.7553NA
52078.4NANA-221.651NA
62116.4NANA-128.484NA
72132.81973.81978.55-4.75116159.001
81874.21946.831986.74-39.9067-72.635
92021.42107.241990.51116.732-85.8405
1021092268.441995.29273.146-159.438
112101.22381.691988.08393.604-280.488
1219131890.631975.11-84.476222.3678
1319651906.311965.27-58.955358.6887
141903.41866.141972.22-106.07237.2553
151837.41868.791985.22-116.43-31.3863
1618881967.341990.09-22.7553-79.3363
1719121778.712000.36-221.651133.293
181971.41899.662028.14-128.48471.7428
192041.62067.472072.22-4.75116-25.8655
202132.22088.932128.84-39.906743.265
212075.42325.222208.48116.732-249.816
2221722590.562317.42273.146-418.563
232284.62829.652436.04393.604-545.046
242396.42480.852565.33-84.4762-84.4488
252539.42660.172719.12-58.9553-120.77
2626882787.342893.41-106.072-99.3363
272964.22994.893111.32-116.43-30.6947
283375.63358.343381.1-22.755317.2553
293271.43466.773688.42-221.651-195.374
303714.83848.623977.11-128.484-133.824
313989.44215.664220.41-4.75116-226.257
324367.24430.954470.86-39.9067-63.7516
335070.44827.874711.13116.732242.534
345651.65166.724893.58273.146484.879
356180.85448.395054.78393.604732.412
365428.6NANA-84.4762NA
375346.4NANA-58.9553NA
385891.8NANA-106.072NA
395527NANA-116.43NA
405191.4NANA-22.7553NA
415324.6NANA-221.651NA


Parameters (Session):
par1 = additive ; par2 = 12 ;
Parameters (R input):
par1 = additive ; par2 = 12 ;
R code (references can be found in the software module):
par2 <- as.numeric(par2)
x <- ts(x,freq=par2)
m <- decompose(x,type=par1)
m$figure
bitmap(file='test1.png')
plot(m)
dev.off()
mylagmax <- length(x)/2
bitmap(file='test2.png')
op <- par(mfrow = c(2,2))
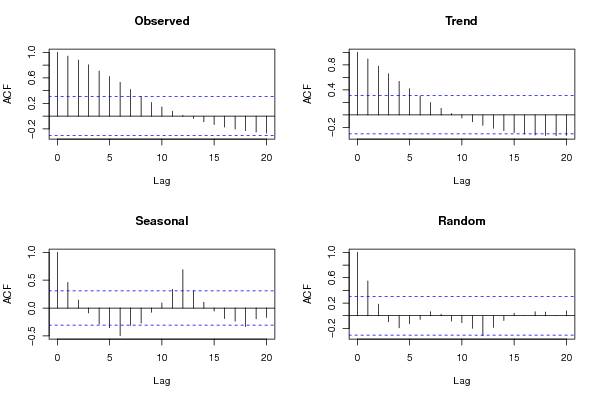
acf(as.numeric(x),lag.max = mylagmax,main='Observed')
acf(as.numeric(m$trend),na.action=na.pass,lag.max = mylagmax,main='Trend')
acf(as.numeric(m$seasonal),na.action=na.pass,lag.max = mylagmax,main='Seasonal')
acf(as.numeric(m$random),na.action=na.pass,lag.max = mylagmax,main='Random')
par(op)
dev.off()
bitmap(file='test3.png')
op <- par(mfrow = c(2,2))
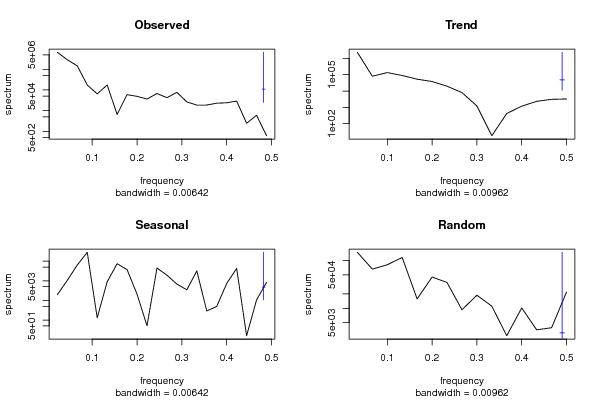
spectrum(as.numeric(x),main='Observed')
spectrum(as.numeric(m$trend[!is.na(m$trend)]),main='Trend')
spectrum(as.numeric(m$seasonal[!is.na(m$seasonal)]),main='Seasonal')
spectrum(as.numeric(m$random[!is.na(m$random)]),main='Random')
par(op)
dev.off()
bitmap(file='test4.png')
op <- par(mfrow = c(2,2))
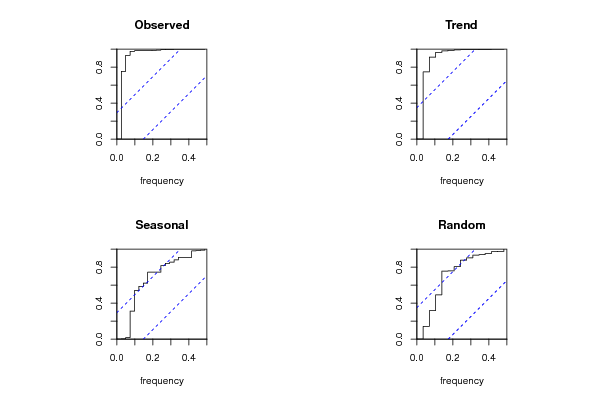
cpgram(as.numeric(x),main='Observed')
cpgram(as.numeric(m$trend[!is.na(m$trend)]),main='Trend')
cpgram(as.numeric(m$seasonal[!is.na(m$seasonal)]),main='Seasonal')
cpgram(as.numeric(m$random[!is.na(m$random)]),main='Random')
par(op)
dev.off()
load(file='createtable')
a<-table.start()
a<-table.row.start(a)
a<-table.element(a,'Classical Decomposition by Moving Averages',6,TRUE)
a<-table.row.end(a)
a<-table.row.start(a)
a<-table.element(a,'t',header=TRUE)
a<-table.element(a,'Observations',header=TRUE)
a<-table.element(a,'Fit',header=TRUE)
a<-table.element(a,'Trend',header=TRUE)
a<-table.element(a,'Seasonal',header=TRUE)
a<-table.element(a,'Random',header=TRUE)
a<-table.row.end(a)
for (i in 1:length(m$trend)) {
a<-table.row.start(a)
a<-table.element(a,i,header=TRUE)
a<-table.element(a,x[i])
if (par1 == 'additive') a<-table.element(a,signif(m$trend[i]+m$seasonal[i],6)) else a<-table.element(a,signif(m$trend[i]*m$seasonal[i],6))
a<-table.element(a,signif(m$trend[i],6))
a<-table.element(a,signif(m$seasonal[i],6))
a<-table.element(a,signif(m$random[i],6))
a<-table.row.end(a)
}
a<-table.end(a)
table.save(a,file='mytable.tab')