Free Statistics

of Irreproducible Research!

Author's title

Author*The author of this computation has been verified*
R Software Modulerwasp_spectrum.wasp
Title produced by softwareSpectral Analysis
Date of computationThu, 01 Dec 2016 11:31:07 +0100
Cite this page as followsStatistical Computations at FreeStatistics.org, Office for Research Development and Education, URL https://freestatistics.org/blog/index.php?v=date/2016/Dec/01/t1480588300acqmtm3lsopme7e.htm/, Retrieved Fri, 01 Nov 2024 03:27:11 +0000
Statistical Computations at FreeStatistics.org, Office for Research Development and Education, URL https://freestatistics.org/blog/index.php?pk=297514, Retrieved Fri, 01 Nov 2024 03:27:11 +0000
QR Codes:

Original text written by user:
IsPrivate?No (this computation is public)
User-defined keywords
Estimated Impact114
Family? (F = Feedback message, R = changed R code, M = changed R Module, P = changed Parameters, D = changed Data)
-     [Spectral Analysis] [Spectral Analysis...] [2016-12-01 10:23:42] [5f979cb1c6fa86b57093c7542788c28c]
- R     [Spectral Analysis] [Spectral Analysis...] [2016-12-01 10:28:25] [5f979cb1c6fa86b57093c7542788c28c]
-           [Spectral Analysis] [Spectral Analysis...] [2016-12-01 10:31:07] [4c05fa0998bf98e29c2e453b139976f4] [Current]
Feedback Forum

Post a new message
Dataseries X:
3281
3397
3498.5
3538
3449.5
3673
3350.5
3604
3673.5
3747
3616
3580.5
3710
3994.5
4091
3954.5
4004
4287
3831
4046.5
4079.5
4029.5
3880
3855
3841.5
4123.5
4133
3958.5
4003
4151.5
3723
3957
3965.5
3861.5
3917.5
3704
3950
4140.5
4090
4162
4066
4358.5
4022.5
4285.5
4373.5
4284.5
4077.5
4122
4181.5
4535.5
4497
4420.5
4370
4712
4475
4578.5
4751.5
4746
4581.5
4645.5
4751
4952.5
4996.5
4998
4986.5
5348
4933
5263
5330.5
5301
5159
5258.5
5411.5
5536.5
5613
5505.5
5476
5782.5
5283
5451.5
5578
5548.5
5379.5
5117.5
5316.5
5505.5
5620.5
5383.5
5461.5
5658.5
5357.5
5622
5608
5604.5
5399
5185
5221
5379.5
5333
5214
5206.5
5630
5285.5
5512.5
5592.5
5554.5
5284.5
5198.5
5241.5
5455
5548.5
5375
5346
5730.5
5457
5603


Summary of computational transaction
Raw Input view raw input (R code)
Raw Outputview raw output of R engine
Computing time1 seconds
R ServerBig Analytics Cloud Computing Center

\begin{tabular}{lllllllll}
\hline
Summary of computational transaction \tabularnewline
Raw Input view raw input (R code)  \tabularnewline
Raw Outputview raw output of R engine  \tabularnewline
Computing time1 seconds \tabularnewline
R ServerBig Analytics Cloud Computing Center \tabularnewline
\hline
\end{tabular}
%Source: https://freestatistics.org/blog/index.php?pk=297514&T=0

[TABLE]
[ROW]
Summary of computational transaction[/C][/ROW] [ROW]Raw Input[/C] view raw input (R code) [/C][/ROW] [ROW]Raw Output[/C]view raw output of R engine [/C][/ROW] [ROW]Computing time[/C]1 seconds[/C][/ROW] [ROW]R Server[/C]Big Analytics Cloud Computing Center[/C][/ROW] [/TABLE] Source: https://freestatistics.org/blog/index.php?pk=297514&T=0

Globally Unique Identifier (entire table): ba.freestatistics.org/blog/index.php?pk=297514&T=0

As an alternative you can also use a QR Code:  

The GUIDs for individual cells are displayed in the table below:

Summary of computational transaction
Raw Input view raw input (R code)
Raw Outputview raw output of R engine
Computing time1 seconds
R ServerBig Analytics Cloud Computing Center


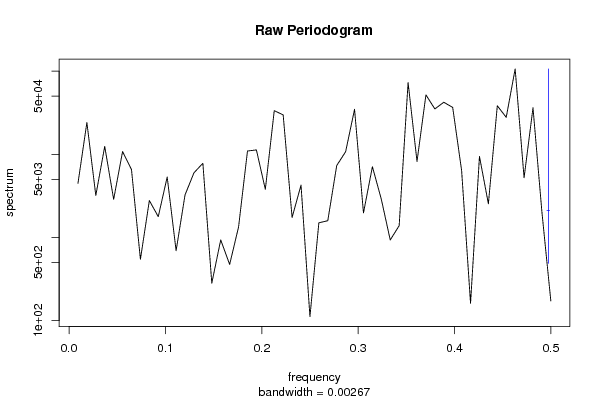
Raw Periodogram
ParameterValue
Box-Cox transformation parameter (lambda)1
Degree of non-seasonal differencing (d)1
Degree of seasonal differencing (D)1
Seasonal Period (s)12
Frequency (Period)Spectrum
0.0093 (108)4472.722228
0.0185 (54)24161.751914
0.0278 (36)3194.911947
0.037 (27)12479.982011
0.0463 (21.6)2868.40297
0.0556 (18)10796.080759
0.0648 (15.4286)6552.055536
0.0741 (13.5)543.932358
0.0833 (12)2776.612935
0.0926 (10.8)1777.24866
0.1019 (9.8182)5329.896453
0.1111 (9)691.411952
0.1204 (8.3077)3241.584072
0.1296 (7.7143)5991.893648
0.1389 (7.2)7797.685807
0.1481 (6.75)281.058607
0.1574 (6.3529)932.555973
0.1667 (6)472.343149
0.1759 (5.6842)1334.198102
0.1852 (5.4)10955.386949
0.1944 (5.1429)11294.227578
0.2037 (4.9091)3788.622136
0.213 (4.6957)33533.291318
0.2222 (4.5)29799.909935
0.2315 (4.32)1737.455466
0.2407 (4.1538)4263.98536
0.25 (4)111.212616
0.2593 (3.8571)1498.275923
0.2685 (3.7241)1588.329761
0.2778 (3.6)7324.497447
0.287 (3.4839)10751.656086
0.2963 (3.375)34820.425615
0.3056 (3.2727)1969.748387
0.3148 (3.1765)7098.494895
0.3241 (3.0857)2877.755187
0.3333 (3)930.801879
0.3426 (2.9189)1382.562013
0.3519 (2.8421)73025.557417
0.3611 (2.7692)8200.735537
0.3704 (2.7)51923.79404
0.3796 (2.6341)35165.49878
0.3889 (2.5714)42332.316613
0.3981 (2.5116)36676.493208
0.4074 (2.4545)6374.026082
0.4167 (2.4)160.987996
0.4259 (2.3478)9440.318891
0.4352 (2.2979)2533.193038
0.4444 (2.25)38378.467852
0.4537 (2.2041)27868.535402
0.463 (2.16)106530.470686
0.4722 (2.1176)5220.815804
0.4815 (2.0769)36356.926727
0.4907 (2.0377)2012.753504
0.5 (2)171.276506

\begin{tabular}{lllllllll}
\hline
Raw Periodogram \tabularnewline
Parameter & Value \tabularnewline
Box-Cox transformation parameter (lambda) & 1 \tabularnewline
Degree of non-seasonal differencing (d) & 1 \tabularnewline
Degree of seasonal differencing (D) & 1 \tabularnewline
Seasonal Period (s) & 12 \tabularnewline
Frequency (Period) & Spectrum \tabularnewline
0.0093 (108) & 4472.722228 \tabularnewline
0.0185 (54) & 24161.751914 \tabularnewline
0.0278 (36) & 3194.911947 \tabularnewline
0.037 (27) & 12479.982011 \tabularnewline
0.0463 (21.6) & 2868.40297 \tabularnewline
0.0556 (18) & 10796.080759 \tabularnewline
0.0648 (15.4286) & 6552.055536 \tabularnewline
0.0741 (13.5) & 543.932358 \tabularnewline
0.0833 (12) & 2776.612935 \tabularnewline
0.0926 (10.8) & 1777.24866 \tabularnewline
0.1019 (9.8182) & 5329.896453 \tabularnewline
0.1111 (9) & 691.411952 \tabularnewline
0.1204 (8.3077) & 3241.584072 \tabularnewline
0.1296 (7.7143) & 5991.893648 \tabularnewline
0.1389 (7.2) & 7797.685807 \tabularnewline
0.1481 (6.75) & 281.058607 \tabularnewline
0.1574 (6.3529) & 932.555973 \tabularnewline
0.1667 (6) & 472.343149 \tabularnewline
0.1759 (5.6842) & 1334.198102 \tabularnewline
0.1852 (5.4) & 10955.386949 \tabularnewline
0.1944 (5.1429) & 11294.227578 \tabularnewline
0.2037 (4.9091) & 3788.622136 \tabularnewline
0.213 (4.6957) & 33533.291318 \tabularnewline
0.2222 (4.5) & 29799.909935 \tabularnewline
0.2315 (4.32) & 1737.455466 \tabularnewline
0.2407 (4.1538) & 4263.98536 \tabularnewline
0.25 (4) & 111.212616 \tabularnewline
0.2593 (3.8571) & 1498.275923 \tabularnewline
0.2685 (3.7241) & 1588.329761 \tabularnewline
0.2778 (3.6) & 7324.497447 \tabularnewline
0.287 (3.4839) & 10751.656086 \tabularnewline
0.2963 (3.375) & 34820.425615 \tabularnewline
0.3056 (3.2727) & 1969.748387 \tabularnewline
0.3148 (3.1765) & 7098.494895 \tabularnewline
0.3241 (3.0857) & 2877.755187 \tabularnewline
0.3333 (3) & 930.801879 \tabularnewline
0.3426 (2.9189) & 1382.562013 \tabularnewline
0.3519 (2.8421) & 73025.557417 \tabularnewline
0.3611 (2.7692) & 8200.735537 \tabularnewline
0.3704 (2.7) & 51923.79404 \tabularnewline
0.3796 (2.6341) & 35165.49878 \tabularnewline
0.3889 (2.5714) & 42332.316613 \tabularnewline
0.3981 (2.5116) & 36676.493208 \tabularnewline
0.4074 (2.4545) & 6374.026082 \tabularnewline
0.4167 (2.4) & 160.987996 \tabularnewline
0.4259 (2.3478) & 9440.318891 \tabularnewline
0.4352 (2.2979) & 2533.193038 \tabularnewline
0.4444 (2.25) & 38378.467852 \tabularnewline
0.4537 (2.2041) & 27868.535402 \tabularnewline
0.463 (2.16) & 106530.470686 \tabularnewline
0.4722 (2.1176) & 5220.815804 \tabularnewline
0.4815 (2.0769) & 36356.926727 \tabularnewline
0.4907 (2.0377) & 2012.753504 \tabularnewline
0.5 (2) & 171.276506 \tabularnewline
\hline
\end{tabular}
%Source: https://freestatistics.org/blog/index.php?pk=297514&T=1

[TABLE]
[ROW][C]Raw Periodogram[/C][/ROW]
[ROW][C]Parameter[/C][C]Value[/C][/ROW]
[ROW][C]Box-Cox transformation parameter (lambda)[/C][C]1[/C][/ROW]
[ROW][C]Degree of non-seasonal differencing (d)[/C][C]1[/C][/ROW]
[ROW][C]Degree of seasonal differencing (D)[/C][C]1[/C][/ROW]
[ROW][C]Seasonal Period (s)[/C][C]12[/C][/ROW]
[ROW][C]Frequency (Period)[/C][C]Spectrum[/C][/ROW]
[ROW][C]0.0093 (108)[/C][C]4472.722228[/C][/ROW]
[ROW][C]0.0185 (54)[/C][C]24161.751914[/C][/ROW]
[ROW][C]0.0278 (36)[/C][C]3194.911947[/C][/ROW]
[ROW][C]0.037 (27)[/C][C]12479.982011[/C][/ROW]
[ROW][C]0.0463 (21.6)[/C][C]2868.40297[/C][/ROW]
[ROW][C]0.0556 (18)[/C][C]10796.080759[/C][/ROW]
[ROW][C]0.0648 (15.4286)[/C][C]6552.055536[/C][/ROW]
[ROW][C]0.0741 (13.5)[/C][C]543.932358[/C][/ROW]
[ROW][C]0.0833 (12)[/C][C]2776.612935[/C][/ROW]
[ROW][C]0.0926 (10.8)[/C][C]1777.24866[/C][/ROW]
[ROW][C]0.1019 (9.8182)[/C][C]5329.896453[/C][/ROW]
[ROW][C]0.1111 (9)[/C][C]691.411952[/C][/ROW]
[ROW][C]0.1204 (8.3077)[/C][C]3241.584072[/C][/ROW]
[ROW][C]0.1296 (7.7143)[/C][C]5991.893648[/C][/ROW]
[ROW][C]0.1389 (7.2)[/C][C]7797.685807[/C][/ROW]
[ROW][C]0.1481 (6.75)[/C][C]281.058607[/C][/ROW]
[ROW][C]0.1574 (6.3529)[/C][C]932.555973[/C][/ROW]
[ROW][C]0.1667 (6)[/C][C]472.343149[/C][/ROW]
[ROW][C]0.1759 (5.6842)[/C][C]1334.198102[/C][/ROW]
[ROW][C]0.1852 (5.4)[/C][C]10955.386949[/C][/ROW]
[ROW][C]0.1944 (5.1429)[/C][C]11294.227578[/C][/ROW]
[ROW][C]0.2037 (4.9091)[/C][C]3788.622136[/C][/ROW]
[ROW][C]0.213 (4.6957)[/C][C]33533.291318[/C][/ROW]
[ROW][C]0.2222 (4.5)[/C][C]29799.909935[/C][/ROW]
[ROW][C]0.2315 (4.32)[/C][C]1737.455466[/C][/ROW]
[ROW][C]0.2407 (4.1538)[/C][C]4263.98536[/C][/ROW]
[ROW][C]0.25 (4)[/C][C]111.212616[/C][/ROW]
[ROW][C]0.2593 (3.8571)[/C][C]1498.275923[/C][/ROW]
[ROW][C]0.2685 (3.7241)[/C][C]1588.329761[/C][/ROW]
[ROW][C]0.2778 (3.6)[/C][C]7324.497447[/C][/ROW]
[ROW][C]0.287 (3.4839)[/C][C]10751.656086[/C][/ROW]
[ROW][C]0.2963 (3.375)[/C][C]34820.425615[/C][/ROW]
[ROW][C]0.3056 (3.2727)[/C][C]1969.748387[/C][/ROW]
[ROW][C]0.3148 (3.1765)[/C][C]7098.494895[/C][/ROW]
[ROW][C]0.3241 (3.0857)[/C][C]2877.755187[/C][/ROW]
[ROW][C]0.3333 (3)[/C][C]930.801879[/C][/ROW]
[ROW][C]0.3426 (2.9189)[/C][C]1382.562013[/C][/ROW]
[ROW][C]0.3519 (2.8421)[/C][C]73025.557417[/C][/ROW]
[ROW][C]0.3611 (2.7692)[/C][C]8200.735537[/C][/ROW]
[ROW][C]0.3704 (2.7)[/C][C]51923.79404[/C][/ROW]
[ROW][C]0.3796 (2.6341)[/C][C]35165.49878[/C][/ROW]
[ROW][C]0.3889 (2.5714)[/C][C]42332.316613[/C][/ROW]
[ROW][C]0.3981 (2.5116)[/C][C]36676.493208[/C][/ROW]
[ROW][C]0.4074 (2.4545)[/C][C]6374.026082[/C][/ROW]
[ROW][C]0.4167 (2.4)[/C][C]160.987996[/C][/ROW]
[ROW][C]0.4259 (2.3478)[/C][C]9440.318891[/C][/ROW]
[ROW][C]0.4352 (2.2979)[/C][C]2533.193038[/C][/ROW]
[ROW][C]0.4444 (2.25)[/C][C]38378.467852[/C][/ROW]
[ROW][C]0.4537 (2.2041)[/C][C]27868.535402[/C][/ROW]
[ROW][C]0.463 (2.16)[/C][C]106530.470686[/C][/ROW]
[ROW][C]0.4722 (2.1176)[/C][C]5220.815804[/C][/ROW]
[ROW][C]0.4815 (2.0769)[/C][C]36356.926727[/C][/ROW]
[ROW][C]0.4907 (2.0377)[/C][C]2012.753504[/C][/ROW]
[ROW][C]0.5 (2)[/C][C]171.276506[/C][/ROW]
[/TABLE]
Source: https://freestatistics.org/blog/index.php?pk=297514&T=1

Globally Unique Identifier (entire table): ba.freestatistics.org/blog/index.php?pk=297514&T=1

As an alternative you can also use a QR Code:  

The GUIDs for individual cells are displayed in the table below:

Raw Periodogram
ParameterValue
Box-Cox transformation parameter (lambda)1
Degree of non-seasonal differencing (d)1
Degree of seasonal differencing (D)1
Seasonal Period (s)12
Frequency (Period)Spectrum
0.0093 (108)4472.722228
0.0185 (54)24161.751914
0.0278 (36)3194.911947
0.037 (27)12479.982011
0.0463 (21.6)2868.40297
0.0556 (18)10796.080759
0.0648 (15.4286)6552.055536
0.0741 (13.5)543.932358
0.0833 (12)2776.612935
0.0926 (10.8)1777.24866
0.1019 (9.8182)5329.896453
0.1111 (9)691.411952
0.1204 (8.3077)3241.584072
0.1296 (7.7143)5991.893648
0.1389 (7.2)7797.685807
0.1481 (6.75)281.058607
0.1574 (6.3529)932.555973
0.1667 (6)472.343149
0.1759 (5.6842)1334.198102
0.1852 (5.4)10955.386949
0.1944 (5.1429)11294.227578
0.2037 (4.9091)3788.622136
0.213 (4.6957)33533.291318
0.2222 (4.5)29799.909935
0.2315 (4.32)1737.455466
0.2407 (4.1538)4263.98536
0.25 (4)111.212616
0.2593 (3.8571)1498.275923
0.2685 (3.7241)1588.329761
0.2778 (3.6)7324.497447
0.287 (3.4839)10751.656086
0.2963 (3.375)34820.425615
0.3056 (3.2727)1969.748387
0.3148 (3.1765)7098.494895
0.3241 (3.0857)2877.755187
0.3333 (3)930.801879
0.3426 (2.9189)1382.562013
0.3519 (2.8421)73025.557417
0.3611 (2.7692)8200.735537
0.3704 (2.7)51923.79404
0.3796 (2.6341)35165.49878
0.3889 (2.5714)42332.316613
0.3981 (2.5116)36676.493208
0.4074 (2.4545)6374.026082
0.4167 (2.4)160.987996
0.4259 (2.3478)9440.318891
0.4352 (2.2979)2533.193038
0.4444 (2.25)38378.467852
0.4537 (2.2041)27868.535402
0.463 (2.16)106530.470686
0.4722 (2.1176)5220.815804
0.4815 (2.0769)36356.926727
0.4907 (2.0377)2012.753504
0.5 (2)171.276506


Parameters (Session):
par1 = 1 ; par2 = 0 ; par3 = 0 ; par4 = 12 ;
Parameters (R input):
par1 = 1 ; par2 = 1 ; par3 = 1 ; par4 = 12 ;
R code (references can be found in the software module):
par4 <- '12'
par3 <- '1'
par2 <- '1'
par1 <- '1'
par1 <- as.numeric(par1)
par2 <- as.numeric(par2)
par3 <- as.numeric(par3)
par4 <- as.numeric(par4)
if (par1 == 0) {
x <- log(x)
} else {
x <- (x ^ par1 - 1) / par1
}
if (par2 > 0) x <- diff(x,lag=1,difference=par2)
if (par3 > 0) x <- diff(x,lag=par4,difference=par3)
bitmap(file='test1.png')
r <- spectrum(x,main='Raw Periodogram')
dev.off()
bitmap(file='test2.png')
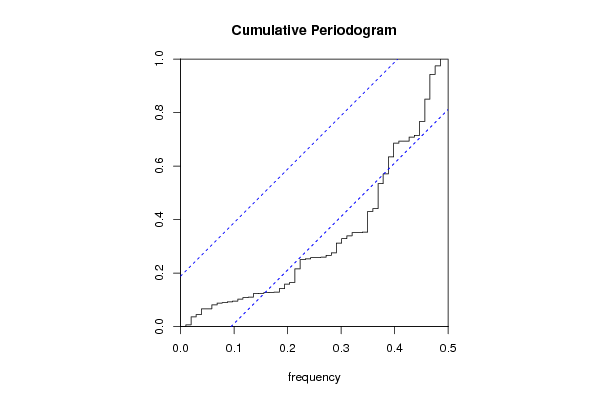
cpgram(x,main='Cumulative Periodogram')
dev.off()
load(file='createtable')
a<-table.start()
a<-table.row.start(a)
a<-table.element(a,'Raw Periodogram',2,TRUE)
a<-table.row.end(a)
a<-table.row.start(a)
a<-table.element(a,'Parameter',header=TRUE)
a<-table.element(a,'Value',header=TRUE)
a<-table.row.end(a)
a<-table.row.start(a)
a<-table.element(a,'Box-Cox transformation parameter (lambda)',header=TRUE)
a<-table.element(a,par1)
a<-table.row.end(a)
a<-table.row.start(a)
a<-table.element(a,'Degree of non-seasonal differencing (d)',header=TRUE)
a<-table.element(a,par2)
a<-table.row.end(a)
a<-table.row.start(a)
a<-table.element(a,'Degree of seasonal differencing (D)',header=TRUE)
a<-table.element(a,par3)
a<-table.row.end(a)
a<-table.row.start(a)
a<-table.element(a,'Seasonal Period (s)',header=TRUE)
a<-table.element(a,par4)
a<-table.row.end(a)
a<-table.row.start(a)
a<-table.element(a,'Frequency (Period)',header=TRUE)
a<-table.element(a,'Spectrum',header=TRUE)
a<-table.row.end(a)
for (i in 1:length(r$freq)) {
a<-table.row.start(a)
mylab <- round(r$freq[i],4)
mylab <- paste(mylab,' (',sep='')
mylab <- paste(mylab,round(1/r$freq[i],4),sep='')
mylab <- paste(mylab,')',sep='')
a<-table.element(a,mylab,header=TRUE)
a<-table.element(a,round(r$spec[i],6))
a<-table.row.end(a)
}
a<-table.end(a)
table.save(a,file='mytable.tab')