B580,regression tree,steven,coomans,thesis,per2maand | ||||||||||||||||||||||||||||||||||||||||||||||||||||||||||
| *Unverified author* | ||||||||||||||||||||||||||||||||||||||||||||||||||||||||||
| R Software Module: /rwasp_regression_trees.wasp (opens new window with default values) | ||||||||||||||||||||||||||||||||||||||||||||||||||||||||||
| Title produced by software: Recursive Partitioning (Regression Trees) | ||||||||||||||||||||||||||||||||||||||||||||||||||||||||||
| Date of computation: Wed, 26 May 2010 11:30:17 +0000 | ||||||||||||||||||||||||||||||||||||||||||||||||||||||||||
| Cite this page as follows: | ||||||||||||||||||||||||||||||||||||||||||||||||||||||||||
| Statistical Computations at FreeStatistics.org, Office for Research Development and Education, URL http://www.freestatistics.org/blog/date/2010/May/26/t1274873454fa9ly4x60c59rvd.htm/, Retrieved Wed, 26 May 2010 13:30:58 +0200 | ||||||||||||||||||||||||||||||||||||||||||||||||||||||||||
| BibTeX entries for LaTeX users: | ||||||||||||||||||||||||||||||||||||||||||||||||||||||||||
@Manual{KEY,
    author = {{YOUR NAME}},
    publisher = {Office for Research Development and Education},
    title = {Statistical Computations at FreeStatistics.org, URL http://www.freestatistics.org/blog/date/2010/May/26/t1274873454fa9ly4x60c59rvd.htm/},
    year = {2010},
}
@Manual{R,
    title = {R: A Language and Environment for Statistical Computing},
    author = {{R Development Core Team}},
    organization = {R Foundation for Statistical Computing},
    address = {Vienna, Austria},
    year = {2010},
    note = {{ISBN} 3-900051-07-0},
    url = {http://www.R-project.org},
}
| ||||||||||||||||||||||||||||||||||||||||||||||||||||||||||
| Original text written by user: | ||||||||||||||||||||||||||||||||||||||||||||||||||||||||||
| IsPrivate? | ||||||||||||||||||||||||||||||||||||||||||||||||||||||||||
| No (this computation is public) | ||||||||||||||||||||||||||||||||||||||||||||||||||||||||||
| User-defined keywords: | ||||||||||||||||||||||||||||||||||||||||||||||||||||||||||
| B580,regression tree,steven,coomans,thesis,per2maand | ||||||||||||||||||||||||||||||||||||||||||||||||||||||||||
| Dataseries X: | ||||||||||||||||||||||||||||||||||||||||||||||||||||||||||
| » Textbox « » Textfile « » CSV « | ||||||||||||||||||||||||||||||||||||||||||||||||||||||||||
| 192 NA 201.992383256927 206.967782536146 212 212.25 192 197.374595777152 201.340376307467 219,9 191.8 194.025 204.248977354664 210.239313211865 225,9 163.7625 193.8025 198.495922223946 201.252485572609 204,05 272.025 190.7985 182.444540071016 188.931303179668 256,65 284.575 198.92115 223.842424405143 236.507656592625 260,375 301.6635 207.486535 251.908814573073 242.02280020498 221,75 287.5375 216.9042315 274.901984222098 249.532404318106 123,05 220.4375 223.96755835 280.741244492589 243.324681715068 277,375 178.3 223.614552515 252.873030359752 213.837340170125 244,4 284.8875 219.0830972635 218.410540574304 195.319860969677 223,8 283.9875 225.66353753715 249.131587099083 242.160129478196 310,9 238 231.495933783435 265.239575959338 241.764621171334 254,4 216.275 232.146340405092 252.651330534283 221.555245324865 254,625 162.875 230.559206364582 235.840709946355 212.008114250888 122,65 185.95 223.790785728124 202.121012334719 188.541288043735 117,775 193.7875 220.006707155312 194.647890420306 198 etc... | ||||||||||||||||||||||||||||||||||||||||||||||||||||||||||
| Output produced by software: | ||||||||||||||||||||||||||||||||||||||||||||||||||||||||||
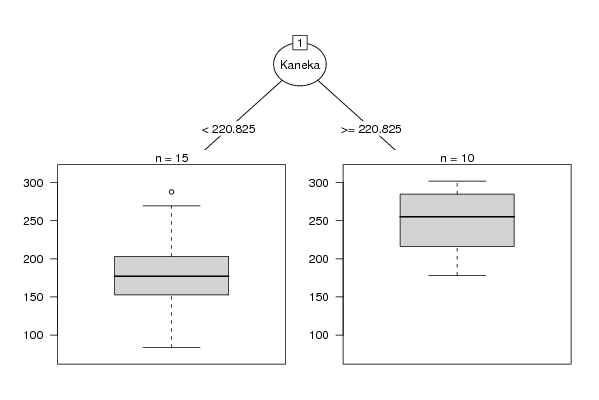
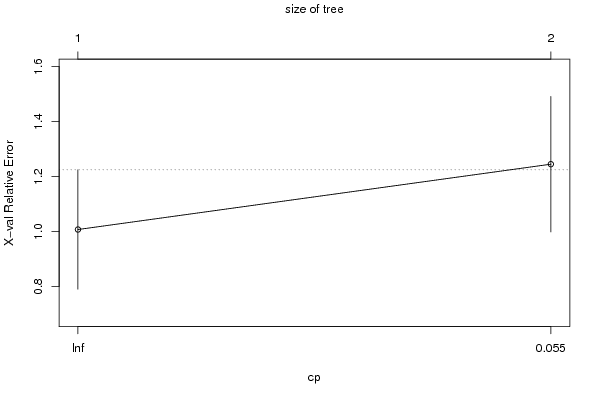
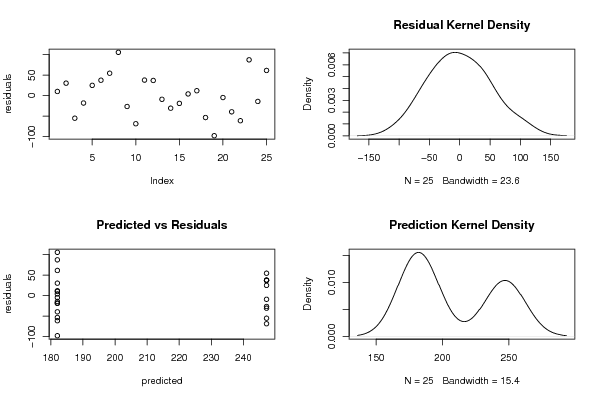
| Charts produced by software: |
| Parameters (Session): | par1 = 1 ; par2 = No ; | | Parameters (R input): | par1 = 1 ; par2 = No ; | | R code (references can be found in the software module): | library(rpart)
| library(partykit) par1 <- as.numeric(par1) autoprune <- function ( tree, method='Minimum CV'){ xerr <- tree$cptable[,'xerror'] cpmin.id <- which.min(xerr) if (method == 'Minimum CV Error plus 1 SD'){ xstd <- tree$cptable[,'xstd'] errt <- xerr[cpmin.id] + xstd[cpmin.id] cpSE1.min <- which.min( errt < xerr ) mycp <- (tree$cptable[,'CP'])[cpSE1.min] } if (method == 'Minimum CV') { mycp <- (tree$cptable[,'CP'])[cpmin.id] } return (mycp) } conf.multi.mat <- function(true, new) { if ( all( is.na(match( levels(true),levels(new) ) )) ) stop ( 'conflict of vector levels') multi.t <- list() for (mylev in levels(true) ) { true.tmp <- true new.tmp <- new left.lev <- levels (true.tmp)[- match(mylev,levels(true) ) ] levels(true.tmp) <- list ( mylev = mylev, all = left.lev ) levels(new.tmp) <- list ( mylev = mylev, all = left.lev ) curr.t <- conf.mat ( true.tmp , new.tmp ) multi.t[[mylev]] <- curr.t multi.t[[mylev]]$precision <- round( curr.t$conf[1,1] / sum( curr.t$conf[1,] ), 2 ) } return (multi.t) } x <- t(y) k <- length(x[1,]) n <- length(x[,1]) x1 <- cbind(x[,par1], x[,1:k!=par1]) mycolnames <- c(colnames(x)[par1], colnames(x)[1:k!=par1]) colnames(x1) <- mycolnames #colnames(x)[par1] m <- rpart(as.data.frame(x1)) par2 if (par2 != 'No') { mincp <- autoprune(m,method=par2) print(mincp) m <- prune(m,cp=mincp) } m$cptable bitmap(file='test1.png') plot(as.party(m),tp_args=list(id=FALSE)) dev.off() bitmap(file='test2.png') plotcp(m) dev.off() cbind(y=m$y,pred=predict(m),res=residuals(m)) myr <- residuals(m) myp <- predict(m) bitmap(file='test4.png') op <- par(mfrow=c(2,2)) plot(myr,ylab='residuals') plot(density(myr),main='Residual Kernel Density') plot(myp,myr,xlab='predicted',ylab='residuals',main='Predicted vs Residuals') plot(density(myp),main='Prediction Kernel Density') par(op) dev.off() load(file='createtable') a<-table.start() a<-table.row.start(a) a<-table.element(a,'Model Performance',6,TRUE) a<-table.row.end(a) a<-table.row.start(a) a<-table.element(a,'#',header=TRUE) a<-table.element(a,'Complexity',header=TRUE) a<-table.element(a,'split',header=TRUE) a<-table.element(a,'relative error',header=TRUE) a<-table.element(a,'CV error',header=TRUE) a<-table.element(a,'CV S.D.',header=TRUE) a<-table.row.end(a) for (i in 1:length(m$cptable[,1])) { a<-table.row.start(a) a<-table.element(a,i,header=TRUE) a<-table.element(a,round(m$cptable[i,'CP'],3)) a<-table.element(a,m$cptable[i,'nsplit']) a<-table.element(a,round(m$cptable[i,'rel error'],3)) a<-table.element(a,round(m$cptable[i,'xerror'],3)) a<-table.element(a,round(m$cptable[i,'xstd'],3)) a<-table.row.end(a) } a<-table.end(a) table.save(a,file='mytable.tab') | Copyright
Software written by Ed van Stee & Patrick Wessa Disclaimer Information provided on this web site is provided "AS IS" without warranty of any kind, either express or implied, including, without limitation, warranties of merchantability, fitness for a particular purpose, and noninfringement. We use reasonable efforts to include accurate and timely information and periodically update the information, and software without notice. However, we make no warranties or representations as to the accuracy or completeness of such information (or software), and we assume no liability or responsibility for errors or omissions in the content of this web site, or any software bugs in online applications. Your use of this web site is AT YOUR OWN RISK. Under no circumstances and under no legal theory shall we be liable to you or any other person for any direct, indirect, special, incidental, exemplary, or consequential damages arising from your access to, or use of, this web site. Privacy Policy We may request personal information to be submitted to our servers in order to be able to:
We NEVER allow other companies to directly offer registered users information about their products and services. Banner references and hyperlinks of third parties NEVER contain any personal data of the visitor. We do NOT sell, nor transmit by any means, personal information, nor statistical data series uploaded by you to third parties.
We store a unique ANONYMOUS USER ID in the form of a small 'Cookie' on your computer. This allows us to track your progress when using this website which is necessary to create state-dependent features. The cookie is used for NO OTHER PURPOSE. At any time you may opt to disallow cookies from this website - this will not affect other features of this website. We examine cookies that are used by third-parties (banner and online ads) very closely: abuse from third-parties automatically results in termination of the advertising contract without refund. We have very good reason to believe that the cookies that are produced by third parties (banner ads) do NOT cause any privacy or security risk. FreeStatistics.org is safe. There is no need to download any software to use the applications and services contained in this website. Hence, your system's security is not compromised by their use, and your personal data - other than data you submit in the account application form, and the user-agent information that is transmitted by your browser - is never transmitted to our servers. As a general rule, we do not log on-line behavior of individuals (other than normal logging of webserver 'hits'). However, in cases of abuse, hacking, unauthorized access, Denial of Service attacks, illegal copying, hotlinking, non-compliance with international webstandards (such as robots.txt), or any other harmful behavior, our system engineers are empowered to log, track, identify, publish, and ban misbehaving individuals - even if this leads to ban entire blocks of IP addresses, or disclosing user's identity. | ||||||||||||||||||||||||||||||||||||||||||||||