Free Statistics

of Irreproducible Research!

Author's title

Author*The author of this computation has been verified*
R Software ModulePatrick.Wessarwasp_regression_trees.wasp
Title produced by softwareRecursive Partitioning (Regression Trees)
Date of computationSat, 01 May 2010 12:50:19 +0000
Cite this page as followsStatistical Computations at FreeStatistics.org, Office for Research Development and Education, URL https://freestatistics.org/blog/index.php?v=date/2010/May/01/t1272718276q846ytbrdehq974.htm/, Retrieved Thu, 25 Apr 2024 07:45:42 +0000
Statistical Computations at FreeStatistics.org, Office for Research Development and Education, URL https://freestatistics.org/blog/index.php?pk=75134, Retrieved Thu, 25 Apr 2024 07:45:42 +0000
QR Codes:

Original text written by user:
IsPrivate?No (this computation is public)
User-defined keywords
Estimated Impact191
Family? (F = Feedback message, R = changed R code, M = changed R Module, P = changed Parameters, D = changed Data)
-     [Multiple Regression] [Sleep in Mammals ...] [2010-03-18 19:36:59] [b98453cac15ba1066b407e146608df68]
- RMP     [Recursive Partitioning (Regression Trees)] [Review of Sleep A...] [2010-05-01 12:50:19] [d76b387543b13b5e3afd8ff9e5fdc89f] [Current]
- RMP       [Recursive Partitioning (Regression Trees)] [] [2010-12-17 14:00:39] [94f495cfd7e7946e5228cbd267a6841d]
Feedback Forum

Post a new message
Dataseries X:
0.30102999566398	3	1.6232492903979
0.25527250510331	4	2.79518458968242
-0.15490195998574	4	2.25527250510331
0.5910646070265	1	1.54406804435028
0	4	2.59328606702046
0.55630250076729	1	1.79934054945358
0.14612803567824	1	2.36172783601759
0.17609125905568	4	2.04921802267018
-0.15490195998574	5	2.44870631990508
0.32221929473392	1	1.6232492903979
0.61278385671974	2	1.6232492903979
0.079181246047625	2	2.07918124604762
-0.30102999566398	5	2.17026171539496
0.53147891704226	2	1.20411998265592
0.17609125905568	1	2.49136169383427
0.53147891704226	3	1.44715803134222
-0.096910013008056	4	1.83250891270624
-0.096910013008056	5	2.52633927738984
0.30102999566398	1	1.69897000433602
0.27875360095283	1	2.42651126136458
0.11394335230684	3	1.27875360095283
0.7481880270062	1	1.07918124604762
0.49136169383427	1	2.07918124604762
0.25527250510331	2	2.14612803567824
-0.045757490560675	4	2.23044892137827
0.25527250510331	2	1.23044892137827
0.27875360095283	4	2.06069784035361
-0.045757490560675	5	1.49136169383427
0.41497334797082	3	1.32221929473392
0.38021124171161	1	1.7160033436348
0.079181246047625	2	2.2148438480477
-0.045757490560675	2	2.35218251811136
-0.30102999566398	3	2.35218251811136
-0.22184874961636	5	2.17897694729317
0.36172783601759	2	1.77815125038364
-0.30102999566398	3	2.30102999566398
0.41497334797082	2	1.66275783168157
-0.22184874961636	4	2.32221929473392
0.81954393554187	1	1.14612803567824


Summary of computational transaction
Raw Inputview raw input (R code)
Raw Outputview raw output of R engine
Computing time3 seconds
R Server'Gwilym Jenkins' @ 72.249.127.135

\begin{tabular}{lllllllll}
\hline
Summary of computational transaction \tabularnewline
Raw Input & view raw input (R code)  \tabularnewline
Raw Output & view raw output of R engine  \tabularnewline
Computing time & 3 seconds \tabularnewline
R Server & 'Gwilym Jenkins' @ 72.249.127.135 \tabularnewline
\hline
\end{tabular}
%Source: https://freestatistics.org/blog/index.php?pk=75134&T=0

[TABLE]
[ROW][C]Summary of computational transaction[/C][/ROW]
[ROW][C]Raw Input[/C][C]view raw input (R code) [/C][/ROW]
[ROW][C]Raw Output[/C][C]view raw output of R engine [/C][/ROW]
[ROW][C]Computing time[/C][C]3 seconds[/C][/ROW]
[ROW][C]R Server[/C][C]'Gwilym Jenkins' @ 72.249.127.135[/C][/ROW]
[/TABLE]
Source: https://freestatistics.org/blog/index.php?pk=75134&T=0

Globally Unique Identifier (entire table): ba.freestatistics.org/blog/index.php?pk=75134&T=0

As an alternative you can also use a QR Code:  

The GUIDs for individual cells are displayed in the table below:

Summary of computational transaction
Raw Inputview raw input (R code)
Raw Outputview raw output of R engine
Computing time3 seconds
R Server'Gwilym Jenkins' @ 72.249.127.135


Model Performance
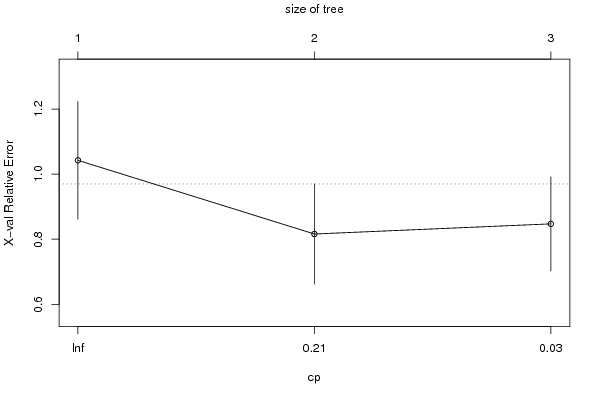
#Complexitysplitrelative errorCV errorCV S.D.
10.488011.0420.181
20.09310.5120.8160.154
30.0120.420.8470.145

\begin{tabular}{lllllllll}
\hline
Model Performance \tabularnewline
# & Complexity & split & relative error & CV error & CV S.D. \tabularnewline
1 & 0.488 & 0 & 1 & 1.042 & 0.181 \tabularnewline
2 & 0.093 & 1 & 0.512 & 0.816 & 0.154 \tabularnewline
3 & 0.01 & 2 & 0.42 & 0.847 & 0.145 \tabularnewline
\hline
\end{tabular}
%Source: https://freestatistics.org/blog/index.php?pk=75134&T=1

[TABLE]
[ROW][C]Model Performance[/C][/ROW]
[ROW][C]#[/C][C]Complexity[/C][C]split[/C][C]relative error[/C][C]CV error[/C][C]CV S.D.[/C][/ROW]
[ROW][C]1[/C][C]0.488[/C][C]0[/C][C]1[/C][C]1.042[/C][C]0.181[/C][/ROW]
[ROW][C]2[/C][C]0.093[/C][C]1[/C][C]0.512[/C][C]0.816[/C][C]0.154[/C][/ROW]
[ROW][C]3[/C][C]0.01[/C][C]2[/C][C]0.42[/C][C]0.847[/C][C]0.145[/C][/ROW]
[/TABLE]
Source: https://freestatistics.org/blog/index.php?pk=75134&T=1

Globally Unique Identifier (entire table): ba.freestatistics.org/blog/index.php?pk=75134&T=1

As an alternative you can also use a QR Code:  

The GUIDs for individual cells are displayed in the table below:

Model Performance
#Complexitysplitrelative errorCV errorCV S.D.
10.488011.0420.181
20.09310.5120.8160.154
30.0120.420.8470.145


Parameters (Session):
par1 = my name ; par2 = my source ; par3 = my description ; par4 = 4 ;
Parameters (R input):
par1 = 1 ; par2 = No ;
R code (references can be found in the software module):
library(rpart)
library(partykit)
par1 <- as.numeric(par1)
autoprune <- function ( tree, method='Minimum CV'){
xerr <- tree$cptable[,'xerror']
cpmin.id <- which.min(xerr)
if (method == 'Minimum CV Error plus 1 SD'){
xstd <- tree$cptable[,'xstd']
errt <- xerr[cpmin.id] + xstd[cpmin.id]
cpSE1.min <- which.min( errt < xerr )
mycp <- (tree$cptable[,'CP'])[cpSE1.min]
}
if (method == 'Minimum CV') {
mycp <- (tree$cptable[,'CP'])[cpmin.id]
}
return (mycp)
}
conf.multi.mat <- function(true, new)
{
if ( all( is.na(match( levels(true),levels(new) ) )) )
stop ( 'conflict of vector levels')
multi.t <- list()
for (mylev in levels(true) ) {
true.tmp <- true
new.tmp <- new
left.lev <- levels (true.tmp)[- match(mylev,levels(true) ) ]
levels(true.tmp) <- list ( mylev = mylev, all = left.lev )
levels(new.tmp) <- list ( mylev = mylev, all = left.lev )
curr.t <- conf.mat ( true.tmp , new.tmp )
multi.t[[mylev]] <- curr.t
multi.t[[mylev]]$precision <-
round( curr.t$conf[1,1] / sum( curr.t$conf[1,] ), 2 )
}
return (multi.t)
}
x <- t(y)
k <- length(x[1,])
n <- length(x[,1])
x1 <- cbind(x[,par1], x[,1:k!=par1])
mycolnames <- c(colnames(x)[par1], colnames(x)[1:k!=par1])
colnames(x1) <- mycolnames #colnames(x)[par1]
m <- rpart(as.data.frame(x1))
par2
if (par2 != 'No') {
mincp <- autoprune(m,method=par2)
print(mincp)
m <- prune(m,cp=mincp)
}
m$cptable
bitmap(file='test1.png')
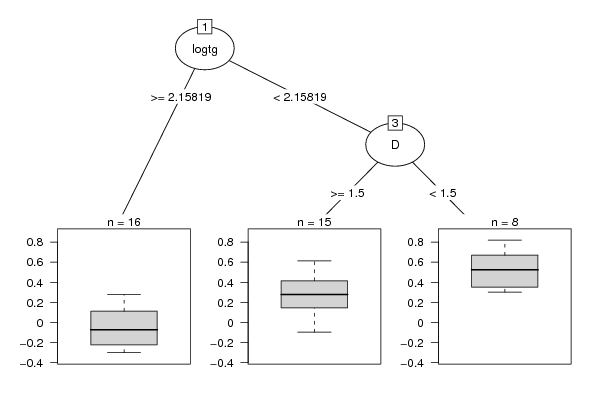
plot(as.party(m),tp_args=list(id=FALSE))
dev.off()
bitmap(file='test2.png')
plotcp(m)
dev.off()
cbind(y=m$y,pred=predict(m),res=residuals(m))
myr <- residuals(m)
myp <- predict(m)
bitmap(file='test4.png')
op <- par(mfrow=c(2,2))
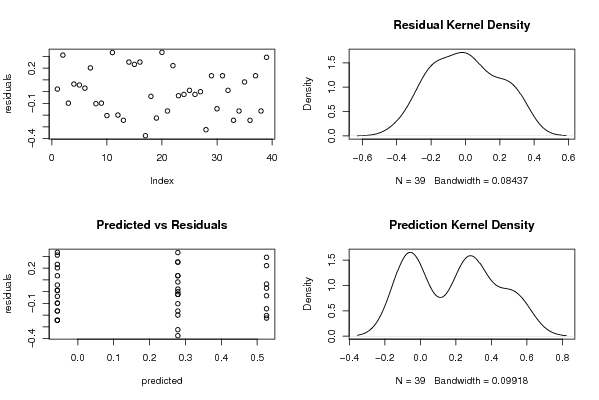
plot(myr,ylab='residuals')
plot(density(myr),main='Residual Kernel Density')
plot(myp,myr,xlab='predicted',ylab='residuals',main='Predicted vs Residuals')
plot(density(myp),main='Prediction Kernel Density')
par(op)
dev.off()
load(file='createtable')
a<-table.start()
a<-table.row.start(a)
a<-table.element(a,'Model Performance',6,TRUE)
a<-table.row.end(a)
a<-table.row.start(a)
a<-table.element(a,'#',header=TRUE)
a<-table.element(a,'Complexity',header=TRUE)
a<-table.element(a,'split',header=TRUE)
a<-table.element(a,'relative error',header=TRUE)
a<-table.element(a,'CV error',header=TRUE)
a<-table.element(a,'CV S.D.',header=TRUE)
a<-table.row.end(a)
for (i in 1:length(m$cptable[,1])) {
a<-table.row.start(a)
a<-table.element(a,i,header=TRUE)
a<-table.element(a,round(m$cptable[i,'CP'],3))
a<-table.element(a,m$cptable[i,'nsplit'])
a<-table.element(a,round(m$cptable[i,'rel error'],3))
a<-table.element(a,round(m$cptable[i,'xerror'],3))
a<-table.element(a,round(m$cptable[i,'xstd'],3))
a<-table.row.end(a)
}
a<-table.end(a)
table.save(a,file='mytable.tab')