Free Statistics
of Irreproducible Research!
Description of Statistical Computation | |||||||||||||||||||||||||||||||||||||||||||||||||||||||||||||||||||||||||||||||||
|---|---|---|---|---|---|---|---|---|---|---|---|---|---|---|---|---|---|---|---|---|---|---|---|---|---|---|---|---|---|---|---|---|---|---|---|---|---|---|---|---|---|---|---|---|---|---|---|---|---|---|---|---|---|---|---|---|---|---|---|---|---|---|---|---|---|---|---|---|---|---|---|---|---|---|---|---|---|---|---|---|---|
| Author's title | |||||||||||||||||||||||||||||||||||||||||||||||||||||||||||||||||||||||||||||||||
| Author | *The author of this computation has been verified* | ||||||||||||||||||||||||||||||||||||||||||||||||||||||||||||||||||||||||||||||||
| R Software Module | Patrick.Wessarwasp_regression_trees.wasp | ||||||||||||||||||||||||||||||||||||||||||||||||||||||||||||||||||||||||||||||||
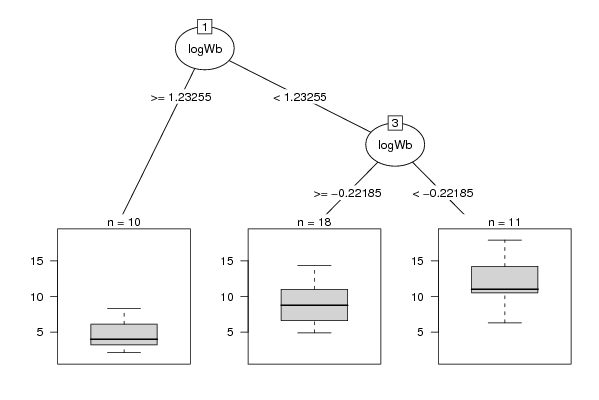
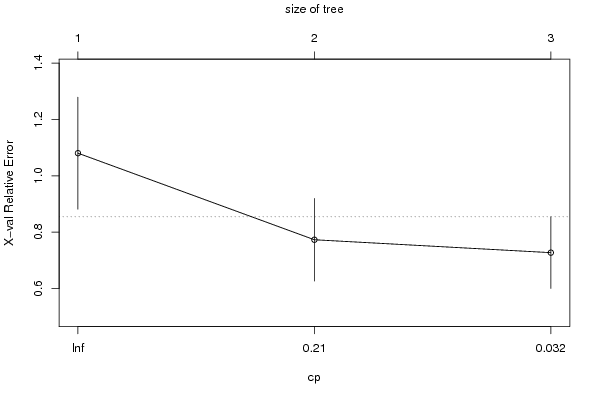
| Title produced by software | Recursive Partitioning (Regression Trees) | ||||||||||||||||||||||||||||||||||||||||||||||||||||||||||||||||||||||||||||||||
| Date of computation | Sat, 01 May 2010 12:04:20 +0000 | ||||||||||||||||||||||||||||||||||||||||||||||||||||||||||||||||||||||||||||||||
| Cite this page as follows | Statistical Computations at FreeStatistics.org, Office for Research Development and Education, URL https://freestatistics.org/blog/index.php?v=date/2010/May/01/t1272715496bompiloburkhyco.htm/, Retrieved Sat, 20 Apr 2024 09:03:47 +0000 | ||||||||||||||||||||||||||||||||||||||||||||||||||||||||||||||||||||||||||||||||
| Statistical Computations at FreeStatistics.org, Office for Research Development and Education, URL https://freestatistics.org/blog/index.php?pk=75123, Retrieved Sat, 20 Apr 2024 09:03:47 +0000 | |||||||||||||||||||||||||||||||||||||||||||||||||||||||||||||||||||||||||||||||||
| QR Codes: | |||||||||||||||||||||||||||||||||||||||||||||||||||||||||||||||||||||||||||||||||
|
| |||||||||||||||||||||||||||||||||||||||||||||||||||||||||||||||||||||||||||||||||
| Original text written by user: | |||||||||||||||||||||||||||||||||||||||||||||||||||||||||||||||||||||||||||||||||
| IsPrivate? | No (this computation is public) | ||||||||||||||||||||||||||||||||||||||||||||||||||||||||||||||||||||||||||||||||
| User-defined keywords | |||||||||||||||||||||||||||||||||||||||||||||||||||||||||||||||||||||||||||||||||
| Estimated Impact | 212 | ||||||||||||||||||||||||||||||||||||||||||||||||||||||||||||||||||||||||||||||||
Tree of Dependent Computations | |||||||||||||||||||||||||||||||||||||||||||||||||||||||||||||||||||||||||||||||||
| Family? (F = Feedback message, R = changed R code, M = changed R Module, P = changed Parameters, D = changed Data) | |||||||||||||||||||||||||||||||||||||||||||||||||||||||||||||||||||||||||||||||||
| - [Multiple Regression] [Sleep in Mammals ...] [2010-03-18 19:12:28] [b98453cac15ba1066b407e146608df68] - RMP [Recursive Partitioning (Regression Trees)] [Review of Sleep A...] [2010-05-01 12:04:20] [d76b387543b13b5e3afd8ff9e5fdc89f] [Current] - RMP [Recursive Partitioning (Regression Trees)] [] [2010-12-17 13:55:13] [94f495cfd7e7946e5228cbd267a6841d] - RMPD [Recursive Partitioning (Regression Trees)] [bonustaak, regres...] [2010-12-20 12:33:09] [94f495cfd7e7946e5228cbd267a6841d] - D [Recursive Partitioning (Regression Trees)] [bonustaak, regres...] [2010-12-20 12:40:26] [94f495cfd7e7946e5228cbd267a6841d] - RMPD [Recursive Partitioning (Regression Trees)] [bonustaak, regres...] [2010-12-20 13:03:05] [698bec0d9310438da89fe441e967c51c] - RMPD [Recursive Partitioning (Regression Trees)] [bonustaak, regres...] [2010-12-20 13:10:46] [94f495cfd7e7946e5228cbd267a6841d] | |||||||||||||||||||||||||||||||||||||||||||||||||||||||||||||||||||||||||||||||||
| Feedback Forum | |||||||||||||||||||||||||||||||||||||||||||||||||||||||||||||||||||||||||||||||||
Post a new message | |||||||||||||||||||||||||||||||||||||||||||||||||||||||||||||||||||||||||||||||||
Dataset | |||||||||||||||||||||||||||||||||||||||||||||||||||||||||||||||||||||||||||||||||
| Dataseries X: | |||||||||||||||||||||||||||||||||||||||||||||||||||||||||||||||||||||||||||||||||
6.3 0 3 2.1 3.40602894496362 4 9.1 1.02325245963371 4 15.8 -1.69897000433602 1 5.2 2.20411998265592 4 10.9 0.51851393987789 1 8.3 1.71733758272386 1 11 -0.36653154442041 4 3.2 2.66745295288995 5 6.3 -1.09691001300806 1 6.6 -0.10237290870956 2 9.5 -0.69897000433602 2 3.3 1.44185217577329 5 11 -0.92081875395238 2 4.7 1.92941892571429 1 10.4 -1 3 7.4 0.01703333929878 4 2.1 2.71683772329952 5 17.9 -2 1 6.1 1.79239168949825 1 11.9 -1.69897000433602 3 13.8 0.23044892137827 1 14.3 0.54406804435028 1 15.2 -0.31875876262441 2 10 1 4 11.9 0.20951501454263 2 6.5 2.28330122870355 4 7.5 0.39794000867204 5 10.6 -0.55284196865778 3 7.4 0.62736585659273 1 8.4 0.83250891270624 2 5.7 -0.1249387366083 2 4.9 0.55630250076729 3 3.2 1.74429298312268 5 11 -0.045757490560675 2 4.9 0.30102999566398 3 13.2 -1 2 9.7 0.6222140229663 4 12.8 0.54406804435028 1 | |||||||||||||||||||||||||||||||||||||||||||||||||||||||||||||||||||||||||||||||||
Tables (Output of Computation) | |||||||||||||||||||||||||||||||||||||||||||||||||||||||||||||||||||||||||||||||||
| |||||||||||||||||||||||||||||||||||||||||||||||||||||||||||||||||||||||||||||||||
Figures (Output of Computation) | |||||||||||||||||||||||||||||||||||||||||||||||||||||||||||||||||||||||||||||||||
Input Parameters & R Code | |||||||||||||||||||||||||||||||||||||||||||||||||||||||||||||||||||||||||||||||||
| Parameters (Session): | |||||||||||||||||||||||||||||||||||||||||||||||||||||||||||||||||||||||||||||||||
| par1 = my name ; par2 = my source ; par3 = my description ; par4 = 4 ; | |||||||||||||||||||||||||||||||||||||||||||||||||||||||||||||||||||||||||||||||||
| Parameters (R input): | |||||||||||||||||||||||||||||||||||||||||||||||||||||||||||||||||||||||||||||||||
| par1 = 1 ; par2 = No ; | |||||||||||||||||||||||||||||||||||||||||||||||||||||||||||||||||||||||||||||||||
| R code (references can be found in the software module): | |||||||||||||||||||||||||||||||||||||||||||||||||||||||||||||||||||||||||||||||||
library(rpart) | |||||||||||||||||||||||||||||||||||||||||||||||||||||||||||||||||||||||||||||||||