Free Statistics

of Irreproducible Research!

Author's title

Author*Unverified author*
R Software Modulerwasp_centraltendency.wasp
Title produced by softwareCentral Tendency
Date of computationSun, 14 Mar 2010 12:57:16 -0600
Cite this page as followsStatistical Computations at FreeStatistics.org, Office for Research Development and Education, URL https://freestatistics.org/blog/index.php?v=date/2010/Mar/14/t1268593083cnljlyx1nnk4pef.htm/, Retrieved Thu, 18 Apr 2024 22:20:55 +0000
Statistical Computations at FreeStatistics.org, Office for Research Development and Education, URL https://freestatistics.org/blog/index.php?pk=74409, Retrieved Thu, 18 Apr 2024 22:20:55 +0000
QR Codes:

Original text written by user:
IsPrivate?No (this computation is public)
User-defined keywords
Estimated Impact169
Family? (F = Feedback message, R = changed R code, M = changed R Module, P = changed Parameters, D = changed Data)
-       [Central Tendency] [Opgave 5, oefening 2] [2010-03-14 18:57:16] [d94b6159ff6bdb6fa568c01df7083ab5] [Current]
Feedback Forum

Post a new message
Dataseries X:
164
96
73
49
39
59
169
169
210
278
298
245
200
188
90
79
78
91
167
169
289
247
275
203
223
104
107
85
75
99
135
211
335
488
326
346
261
224
141
148
145
223
272
445
560
612
467
404
518
404
300
210
196
186
247
343
464
680
711
610
513
292
273
322
189
257
324
404
677
858
895
664
628
308
324
248
272


Summary of computational transaction
Raw Inputview raw input (R code)
Raw Outputview raw output of R engine
Computing time1 seconds
R Server'Gwilym Jenkins' @ 72.249.127.135
R Framework error message
Warning: there are blank lines in the 'Data' field.
Please, use NA for missing data - blank lines are simply
 deleted and are NOT treated as missing values.

\begin{tabular}{lllllllll}
\hline
Summary of computational transaction \tabularnewline
Raw Input & view raw input (R code)  \tabularnewline
Raw Output & view raw output of R engine  \tabularnewline
Computing time & 1 seconds \tabularnewline
R Server & 'Gwilym Jenkins' @ 72.249.127.135 \tabularnewline
R Framework error message & 
Warning: there are blank lines in the 'Data' field.
Please, use NA for missing data - blank lines are simply
 deleted and are NOT treated as missing values.
\tabularnewline \hline \end{tabular} %Source: https://freestatistics.org/blog/index.php?pk=74409&T=0

[TABLE]
[ROW][C]Summary of computational transaction[/C][/ROW]
[ROW][C]Raw Input[/C][C]view raw input (R code) [/C][/ROW]
[ROW][C]Raw Output[/C][C]view raw output of R engine [/C][/ROW]
[ROW][C]Computing time[/C][C]1 seconds[/C][/ROW]
[ROW][C]R Server[/C][C]'Gwilym Jenkins' @ 72.249.127.135[/C][/ROW]
[ROW][C]R Framework error message[/C][C]
Warning: there are blank lines in the 'Data' field.
Please, use NA for missing data - blank lines are simply
 deleted and are NOT treated as missing values.
[/C][/ROW] [/TABLE] Source: https://freestatistics.org/blog/index.php?pk=74409&T=0

Globally Unique Identifier (entire table): ba.freestatistics.org/blog/index.php?pk=74409&T=0

As an alternative you can also use a QR Code:  

The GUIDs for individual cells are displayed in the table below:

Summary of computational transaction
Raw Inputview raw input (R code)
Raw Outputview raw output of R engine
Computing time1 seconds
R Server'Gwilym Jenkins' @ 72.249.127.135
R Framework error message
Warning: there are blank lines in the 'Data' field.
Please, use NA for missing data - blank lines are simply
 deleted and are NOT treated as missing values.


Central Tendency - Ungrouped Data
MeasureValueS.E.Value/S.E.
Arithmetic Mean294.51948051948122.108356551044413.3216360899321
Geometric Mean236.358840652421
Harmonic Mean183.164793041416
Quadratic Mean351.978637191181
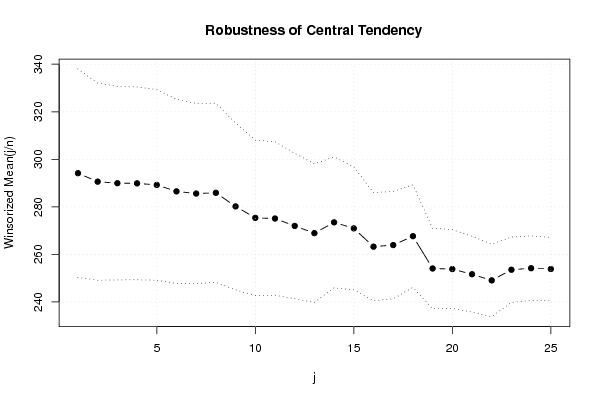
Winsorized Mean ( 1 / 25 )294.16883116883121.921732106520113.4190505448854
Winsorized Mean ( 2 / 25 )290.61038961039020.724053240663614.0228548071943
Winsorized Mean ( 3 / 25 )289.94805194805220.331933609490214.2607219518322
Winsorized Mean ( 4 / 25 )289.89610389610420.278154477521214.2959806434782
Winsorized Mean ( 5 / 25 )289.24675324675320.041184150336414.4326179070561
Winsorized Mean ( 6 / 25 )286.51948051948119.359317880199414.8000814022756
Winsorized Mean ( 7 / 25 )285.61038961039018.949190578934315.0724321664642
Winsorized Mean ( 8 / 25 )285.92207792207818.830373566067415.1840895199930
Winsorized Mean ( 9 / 25 )280.19480519480517.537217907878315.9771525145350
Winsorized Mean ( 10 / 25 )275.38961038961016.337406556379516.8563847290728
Winsorized Mean ( 11 / 25 )275.10389610389616.136609057823317.0484328595989
Winsorized Mean ( 12 / 25 )271.98701298701315.283742557728317.7958384184823
Winsorized Mean ( 13 / 25 )268.94805194805214.562882434687418.4680507553535
Winsorized Mean ( 14 / 25 )273.49350649350713.753674999803319.885122085364
Winsorized Mean ( 15 / 25 )270.96103896103912.933718742313720.9499714938572
Winsorized Mean ( 16 / 25 )263.27272727272711.37020179443123.1546222338530
Winsorized Mean ( 17 / 25 )263.93506493506511.280087550233023.3983170573541
Winsorized Mean ( 18 / 25 )267.67532467532510.790388395958024.8068294534785
Winsorized Mean ( 19 / 25 )254.1038961038968.4615366411378230.0304669093446
Winsorized Mean ( 20 / 25 )253.8441558441568.2804578706656730.6558115274547
Winsorized Mean ( 21 / 25 )251.6623376623387.9758395078057831.5530844641547
Winsorized Mean ( 22 / 25 )249.0909090909097.628376840824432.6531992701071
Winsorized Mean ( 23 / 25 )253.5714285714296.8678928608710536.9212848406707
Winsorized Mean ( 24 / 25 )254.1948051948056.787544354174837.4501869793982
Winsorized Mean ( 25 / 25 )253.870129870136.658251569354938.1286479229151
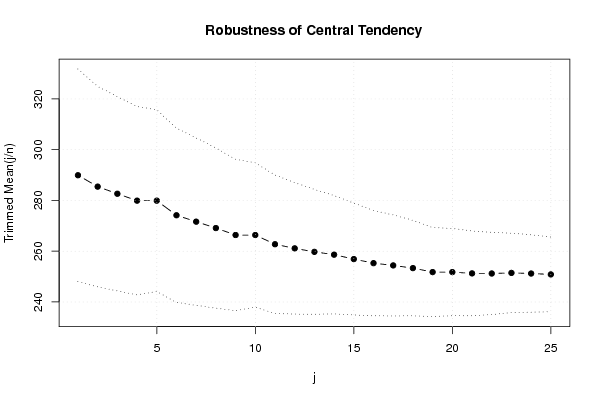
Trimmed Mean ( 1 / 25 )289.9220.936986196465613.8472651832259
Trimmed Mean ( 2 / 25 )285.43835616438419.752367123056214.4508429995310
Trimmed Mean ( 3 / 25 )282.63380281690119.124312582815614.7787692547373
Trimmed Mean ( 4 / 25 )279.91304347826118.554816591000715.0857348605656
Trimmed Mean ( 5 / 25 )279.91304347826117.889231931600315.6470129376438
Trimmed Mean ( 6 / 25 )274.15384615384617.161930011393715.9745346806470
Trimmed Mean ( 7 / 25 )271.63492063492116.485657649448516.4770448599003
Trimmed Mean ( 8 / 25 )269.11475409836115.772392328366717.0623928504718
Trimmed Mean ( 9 / 25 )266.37288135593214.920045986572217.8533552507589
Trimmed Mean ( 10 / 25 )266.37288135593214.210046326866918.7453914806950
Trimmed Mean ( 11 / 25 )262.74545454545513.629592931905219.2775716676321
Trimmed Mean ( 12 / 25 )261.1132075471712.949372792398720.1641586610622
Trimmed Mean ( 13 / 25 )259.74509803921612.301533242147121.1148555977791
Trimmed Mean ( 14 / 25 )258.63265306122511.655839018672622.1891064767536
Trimmed Mean ( 15 / 25 )256.89361702127711.007029712510723.3390500190336
Trimmed Mean ( 16 / 25 )255.28888888888910.3720010742924.6132725074331
Trimmed Mean ( 17 / 25 )254.3953488372099.9470435868334825.5749707555260
Trimmed Mean ( 18 / 25 )253.3414634146349.4011292624809226.9479821350503
Trimmed Mean ( 19 / 25 )251.7692307692318.7770758288786628.6848644899307
Trimmed Mean ( 20 / 25 )251.7692307692318.5819334659764729.3371221959927
Trimmed Mean ( 21 / 25 )251.2571428571438.3475294847876930.0995813569784
Trimmed Mean ( 22 / 25 )251.2121212121218.0916574106332531.0458177433468
Trimmed Mean ( 23 / 25 )251.4516129032267.8142190096316832.1787260624882
Trimmed Mean ( 24 / 25 )251.2068965517247.627306936869932.9352022451603
Trimmed Mean ( 25 / 25 )250.8518518518527.3517065297412934.1215812732774
Median248
Midrange467
Midmean - Weighted Average at Xnp249.289473684211
Midmean - Weighted Average at X(n+1)p251.769230769231
Midmean - Empirical Distribution Function251.769230769231
Midmean - Empirical Distribution Function - Averaging251.769230769231
Midmean - Empirical Distribution Function - Interpolation251.769230769231
Midmean - Closest Observation249.575
Midmean - True Basic - Statistics Graphics Toolkit251.769230769231
Midmean - MS Excel (old versions)251.769230769231
Number of observations77

\begin{tabular}{lllllllll}
\hline
Central Tendency - Ungrouped Data \tabularnewline
Measure & Value & S.E. & Value/S.E. \tabularnewline
Arithmetic Mean & 294.519480519481 & 22.1083565510444 & 13.3216360899321 \tabularnewline
Geometric Mean & 236.358840652421 &  &  \tabularnewline
Harmonic Mean & 183.164793041416 &  &  \tabularnewline
Quadratic Mean & 351.978637191181 &  &  \tabularnewline
Winsorized Mean ( 1 / 25 ) & 294.168831168831 & 21.9217321065201 & 13.4190505448854 \tabularnewline
Winsorized Mean ( 2 / 25 ) & 290.610389610390 & 20.7240532406636 & 14.0228548071943 \tabularnewline
Winsorized Mean ( 3 / 25 ) & 289.948051948052 & 20.3319336094902 & 14.2607219518322 \tabularnewline
Winsorized Mean ( 4 / 25 ) & 289.896103896104 & 20.2781544775212 & 14.2959806434782 \tabularnewline
Winsorized Mean ( 5 / 25 ) & 289.246753246753 & 20.0411841503364 & 14.4326179070561 \tabularnewline
Winsorized Mean ( 6 / 25 ) & 286.519480519481 & 19.3593178801994 & 14.8000814022756 \tabularnewline
Winsorized Mean ( 7 / 25 ) & 285.610389610390 & 18.9491905789343 & 15.0724321664642 \tabularnewline
Winsorized Mean ( 8 / 25 ) & 285.922077922078 & 18.8303735660674 & 15.1840895199930 \tabularnewline
Winsorized Mean ( 9 / 25 ) & 280.194805194805 & 17.5372179078783 & 15.9771525145350 \tabularnewline
Winsorized Mean ( 10 / 25 ) & 275.389610389610 & 16.3374065563795 & 16.8563847290728 \tabularnewline
Winsorized Mean ( 11 / 25 ) & 275.103896103896 & 16.1366090578233 & 17.0484328595989 \tabularnewline
Winsorized Mean ( 12 / 25 ) & 271.987012987013 & 15.2837425577283 & 17.7958384184823 \tabularnewline
Winsorized Mean ( 13 / 25 ) & 268.948051948052 & 14.5628824346874 & 18.4680507553535 \tabularnewline
Winsorized Mean ( 14 / 25 ) & 273.493506493507 & 13.7536749998033 & 19.885122085364 \tabularnewline
Winsorized Mean ( 15 / 25 ) & 270.961038961039 & 12.9337187423137 & 20.9499714938572 \tabularnewline
Winsorized Mean ( 16 / 25 ) & 263.272727272727 & 11.370201794431 & 23.1546222338530 \tabularnewline
Winsorized Mean ( 17 / 25 ) & 263.935064935065 & 11.2800875502330 & 23.3983170573541 \tabularnewline
Winsorized Mean ( 18 / 25 ) & 267.675324675325 & 10.7903883959580 & 24.8068294534785 \tabularnewline
Winsorized Mean ( 19 / 25 ) & 254.103896103896 & 8.46153664113782 & 30.0304669093446 \tabularnewline
Winsorized Mean ( 20 / 25 ) & 253.844155844156 & 8.28045787066567 & 30.6558115274547 \tabularnewline
Winsorized Mean ( 21 / 25 ) & 251.662337662338 & 7.97583950780578 & 31.5530844641547 \tabularnewline
Winsorized Mean ( 22 / 25 ) & 249.090909090909 & 7.6283768408244 & 32.6531992701071 \tabularnewline
Winsorized Mean ( 23 / 25 ) & 253.571428571429 & 6.86789286087105 & 36.9212848406707 \tabularnewline
Winsorized Mean ( 24 / 25 ) & 254.194805194805 & 6.7875443541748 & 37.4501869793982 \tabularnewline
Winsorized Mean ( 25 / 25 ) & 253.87012987013 & 6.6582515693549 & 38.1286479229151 \tabularnewline
Trimmed Mean ( 1 / 25 ) & 289.92 & 20.9369861964656 & 13.8472651832259 \tabularnewline
Trimmed Mean ( 2 / 25 ) & 285.438356164384 & 19.7523671230562 & 14.4508429995310 \tabularnewline
Trimmed Mean ( 3 / 25 ) & 282.633802816901 & 19.1243125828156 & 14.7787692547373 \tabularnewline
Trimmed Mean ( 4 / 25 ) & 279.913043478261 & 18.5548165910007 & 15.0857348605656 \tabularnewline
Trimmed Mean ( 5 / 25 ) & 279.913043478261 & 17.8892319316003 & 15.6470129376438 \tabularnewline
Trimmed Mean ( 6 / 25 ) & 274.153846153846 & 17.1619300113937 & 15.9745346806470 \tabularnewline
Trimmed Mean ( 7 / 25 ) & 271.634920634921 & 16.4856576494485 & 16.4770448599003 \tabularnewline
Trimmed Mean ( 8 / 25 ) & 269.114754098361 & 15.7723923283667 & 17.0623928504718 \tabularnewline
Trimmed Mean ( 9 / 25 ) & 266.372881355932 & 14.9200459865722 & 17.8533552507589 \tabularnewline
Trimmed Mean ( 10 / 25 ) & 266.372881355932 & 14.2100463268669 & 18.7453914806950 \tabularnewline
Trimmed Mean ( 11 / 25 ) & 262.745454545455 & 13.6295929319052 & 19.2775716676321 \tabularnewline
Trimmed Mean ( 12 / 25 ) & 261.11320754717 & 12.9493727923987 & 20.1641586610622 \tabularnewline
Trimmed Mean ( 13 / 25 ) & 259.745098039216 & 12.3015332421471 & 21.1148555977791 \tabularnewline
Trimmed Mean ( 14 / 25 ) & 258.632653061225 & 11.6558390186726 & 22.1891064767536 \tabularnewline
Trimmed Mean ( 15 / 25 ) & 256.893617021277 & 11.0070297125107 & 23.3390500190336 \tabularnewline
Trimmed Mean ( 16 / 25 ) & 255.288888888889 & 10.37200107429 & 24.6132725074331 \tabularnewline
Trimmed Mean ( 17 / 25 ) & 254.395348837209 & 9.94704358683348 & 25.5749707555260 \tabularnewline
Trimmed Mean ( 18 / 25 ) & 253.341463414634 & 9.40112926248092 & 26.9479821350503 \tabularnewline
Trimmed Mean ( 19 / 25 ) & 251.769230769231 & 8.77707582887866 & 28.6848644899307 \tabularnewline
Trimmed Mean ( 20 / 25 ) & 251.769230769231 & 8.58193346597647 & 29.3371221959927 \tabularnewline
Trimmed Mean ( 21 / 25 ) & 251.257142857143 & 8.34752948478769 & 30.0995813569784 \tabularnewline
Trimmed Mean ( 22 / 25 ) & 251.212121212121 & 8.09165741063325 & 31.0458177433468 \tabularnewline
Trimmed Mean ( 23 / 25 ) & 251.451612903226 & 7.81421900963168 & 32.1787260624882 \tabularnewline
Trimmed Mean ( 24 / 25 ) & 251.206896551724 & 7.6273069368699 & 32.9352022451603 \tabularnewline
Trimmed Mean ( 25 / 25 ) & 250.851851851852 & 7.35170652974129 & 34.1215812732774 \tabularnewline
Median & 248 &  &  \tabularnewline
Midrange & 467 &  &  \tabularnewline
Midmean - Weighted Average at Xnp & 249.289473684211 &  &  \tabularnewline
Midmean - Weighted Average at X(n+1)p & 251.769230769231 &  &  \tabularnewline
Midmean - Empirical Distribution Function & 251.769230769231 &  &  \tabularnewline
Midmean - Empirical Distribution Function - Averaging & 251.769230769231 &  &  \tabularnewline
Midmean - Empirical Distribution Function - Interpolation & 251.769230769231 &  &  \tabularnewline
Midmean - Closest Observation & 249.575 &  &  \tabularnewline
Midmean - True Basic - Statistics Graphics Toolkit & 251.769230769231 &  &  \tabularnewline
Midmean - MS Excel (old versions) & 251.769230769231 &  &  \tabularnewline
Number of observations & 77 &  &  \tabularnewline
\hline
\end{tabular}
%Source: https://freestatistics.org/blog/index.php?pk=74409&T=1

[TABLE]
[ROW][C]Central Tendency - Ungrouped Data[/C][/ROW]
[ROW][C]Measure[/C][C]Value[/C][C]S.E.[/C][C]Value/S.E.[/C][/ROW]
[ROW][C]Arithmetic Mean[/C][C]294.519480519481[/C][C]22.1083565510444[/C][C]13.3216360899321[/C][/ROW]
[ROW][C]Geometric Mean[/C][C]236.358840652421[/C][C][/C][C][/C][/ROW]
[ROW][C]Harmonic Mean[/C][C]183.164793041416[/C][C][/C][C][/C][/ROW]
[ROW][C]Quadratic Mean[/C][C]351.978637191181[/C][C][/C][C][/C][/ROW]
[ROW][C]Winsorized Mean ( 1 / 25 )[/C][C]294.168831168831[/C][C]21.9217321065201[/C][C]13.4190505448854[/C][/ROW]
[ROW][C]Winsorized Mean ( 2 / 25 )[/C][C]290.610389610390[/C][C]20.7240532406636[/C][C]14.0228548071943[/C][/ROW]
[ROW][C]Winsorized Mean ( 3 / 25 )[/C][C]289.948051948052[/C][C]20.3319336094902[/C][C]14.2607219518322[/C][/ROW]
[ROW][C]Winsorized Mean ( 4 / 25 )[/C][C]289.896103896104[/C][C]20.2781544775212[/C][C]14.2959806434782[/C][/ROW]
[ROW][C]Winsorized Mean ( 5 / 25 )[/C][C]289.246753246753[/C][C]20.0411841503364[/C][C]14.4326179070561[/C][/ROW]
[ROW][C]Winsorized Mean ( 6 / 25 )[/C][C]286.519480519481[/C][C]19.3593178801994[/C][C]14.8000814022756[/C][/ROW]
[ROW][C]Winsorized Mean ( 7 / 25 )[/C][C]285.610389610390[/C][C]18.9491905789343[/C][C]15.0724321664642[/C][/ROW]
[ROW][C]Winsorized Mean ( 8 / 25 )[/C][C]285.922077922078[/C][C]18.8303735660674[/C][C]15.1840895199930[/C][/ROW]
[ROW][C]Winsorized Mean ( 9 / 25 )[/C][C]280.194805194805[/C][C]17.5372179078783[/C][C]15.9771525145350[/C][/ROW]
[ROW][C]Winsorized Mean ( 10 / 25 )[/C][C]275.389610389610[/C][C]16.3374065563795[/C][C]16.8563847290728[/C][/ROW]
[ROW][C]Winsorized Mean ( 11 / 25 )[/C][C]275.103896103896[/C][C]16.1366090578233[/C][C]17.0484328595989[/C][/ROW]
[ROW][C]Winsorized Mean ( 12 / 25 )[/C][C]271.987012987013[/C][C]15.2837425577283[/C][C]17.7958384184823[/C][/ROW]
[ROW][C]Winsorized Mean ( 13 / 25 )[/C][C]268.948051948052[/C][C]14.5628824346874[/C][C]18.4680507553535[/C][/ROW]
[ROW][C]Winsorized Mean ( 14 / 25 )[/C][C]273.493506493507[/C][C]13.7536749998033[/C][C]19.885122085364[/C][/ROW]
[ROW][C]Winsorized Mean ( 15 / 25 )[/C][C]270.961038961039[/C][C]12.9337187423137[/C][C]20.9499714938572[/C][/ROW]
[ROW][C]Winsorized Mean ( 16 / 25 )[/C][C]263.272727272727[/C][C]11.370201794431[/C][C]23.1546222338530[/C][/ROW]
[ROW][C]Winsorized Mean ( 17 / 25 )[/C][C]263.935064935065[/C][C]11.2800875502330[/C][C]23.3983170573541[/C][/ROW]
[ROW][C]Winsorized Mean ( 18 / 25 )[/C][C]267.675324675325[/C][C]10.7903883959580[/C][C]24.8068294534785[/C][/ROW]
[ROW][C]Winsorized Mean ( 19 / 25 )[/C][C]254.103896103896[/C][C]8.46153664113782[/C][C]30.0304669093446[/C][/ROW]
[ROW][C]Winsorized Mean ( 20 / 25 )[/C][C]253.844155844156[/C][C]8.28045787066567[/C][C]30.6558115274547[/C][/ROW]
[ROW][C]Winsorized Mean ( 21 / 25 )[/C][C]251.662337662338[/C][C]7.97583950780578[/C][C]31.5530844641547[/C][/ROW]
[ROW][C]Winsorized Mean ( 22 / 25 )[/C][C]249.090909090909[/C][C]7.6283768408244[/C][C]32.6531992701071[/C][/ROW]
[ROW][C]Winsorized Mean ( 23 / 25 )[/C][C]253.571428571429[/C][C]6.86789286087105[/C][C]36.9212848406707[/C][/ROW]
[ROW][C]Winsorized Mean ( 24 / 25 )[/C][C]254.194805194805[/C][C]6.7875443541748[/C][C]37.4501869793982[/C][/ROW]
[ROW][C]Winsorized Mean ( 25 / 25 )[/C][C]253.87012987013[/C][C]6.6582515693549[/C][C]38.1286479229151[/C][/ROW]
[ROW][C]Trimmed Mean ( 1 / 25 )[/C][C]289.92[/C][C]20.9369861964656[/C][C]13.8472651832259[/C][/ROW]
[ROW][C]Trimmed Mean ( 2 / 25 )[/C][C]285.438356164384[/C][C]19.7523671230562[/C][C]14.4508429995310[/C][/ROW]
[ROW][C]Trimmed Mean ( 3 / 25 )[/C][C]282.633802816901[/C][C]19.1243125828156[/C][C]14.7787692547373[/C][/ROW]
[ROW][C]Trimmed Mean ( 4 / 25 )[/C][C]279.913043478261[/C][C]18.5548165910007[/C][C]15.0857348605656[/C][/ROW]
[ROW][C]Trimmed Mean ( 5 / 25 )[/C][C]279.913043478261[/C][C]17.8892319316003[/C][C]15.6470129376438[/C][/ROW]
[ROW][C]Trimmed Mean ( 6 / 25 )[/C][C]274.153846153846[/C][C]17.1619300113937[/C][C]15.9745346806470[/C][/ROW]
[ROW][C]Trimmed Mean ( 7 / 25 )[/C][C]271.634920634921[/C][C]16.4856576494485[/C][C]16.4770448599003[/C][/ROW]
[ROW][C]Trimmed Mean ( 8 / 25 )[/C][C]269.114754098361[/C][C]15.7723923283667[/C][C]17.0623928504718[/C][/ROW]
[ROW][C]Trimmed Mean ( 9 / 25 )[/C][C]266.372881355932[/C][C]14.9200459865722[/C][C]17.8533552507589[/C][/ROW]
[ROW][C]Trimmed Mean ( 10 / 25 )[/C][C]266.372881355932[/C][C]14.2100463268669[/C][C]18.7453914806950[/C][/ROW]
[ROW][C]Trimmed Mean ( 11 / 25 )[/C][C]262.745454545455[/C][C]13.6295929319052[/C][C]19.2775716676321[/C][/ROW]
[ROW][C]Trimmed Mean ( 12 / 25 )[/C][C]261.11320754717[/C][C]12.9493727923987[/C][C]20.1641586610622[/C][/ROW]
[ROW][C]Trimmed Mean ( 13 / 25 )[/C][C]259.745098039216[/C][C]12.3015332421471[/C][C]21.1148555977791[/C][/ROW]
[ROW][C]Trimmed Mean ( 14 / 25 )[/C][C]258.632653061225[/C][C]11.6558390186726[/C][C]22.1891064767536[/C][/ROW]
[ROW][C]Trimmed Mean ( 15 / 25 )[/C][C]256.893617021277[/C][C]11.0070297125107[/C][C]23.3390500190336[/C][/ROW]
[ROW][C]Trimmed Mean ( 16 / 25 )[/C][C]255.288888888889[/C][C]10.37200107429[/C][C]24.6132725074331[/C][/ROW]
[ROW][C]Trimmed Mean ( 17 / 25 )[/C][C]254.395348837209[/C][C]9.94704358683348[/C][C]25.5749707555260[/C][/ROW]
[ROW][C]Trimmed Mean ( 18 / 25 )[/C][C]253.341463414634[/C][C]9.40112926248092[/C][C]26.9479821350503[/C][/ROW]
[ROW][C]Trimmed Mean ( 19 / 25 )[/C][C]251.769230769231[/C][C]8.77707582887866[/C][C]28.6848644899307[/C][/ROW]
[ROW][C]Trimmed Mean ( 20 / 25 )[/C][C]251.769230769231[/C][C]8.58193346597647[/C][C]29.3371221959927[/C][/ROW]
[ROW][C]Trimmed Mean ( 21 / 25 )[/C][C]251.257142857143[/C][C]8.34752948478769[/C][C]30.0995813569784[/C][/ROW]
[ROW][C]Trimmed Mean ( 22 / 25 )[/C][C]251.212121212121[/C][C]8.09165741063325[/C][C]31.0458177433468[/C][/ROW]
[ROW][C]Trimmed Mean ( 23 / 25 )[/C][C]251.451612903226[/C][C]7.81421900963168[/C][C]32.1787260624882[/C][/ROW]
[ROW][C]Trimmed Mean ( 24 / 25 )[/C][C]251.206896551724[/C][C]7.6273069368699[/C][C]32.9352022451603[/C][/ROW]
[ROW][C]Trimmed Mean ( 25 / 25 )[/C][C]250.851851851852[/C][C]7.35170652974129[/C][C]34.1215812732774[/C][/ROW]
[ROW][C]Median[/C][C]248[/C][C][/C][C][/C][/ROW]
[ROW][C]Midrange[/C][C]467[/C][C][/C][C][/C][/ROW]
[ROW][C]Midmean - Weighted Average at Xnp[/C][C]249.289473684211[/C][C][/C][C][/C][/ROW]
[ROW][C]Midmean - Weighted Average at X(n+1)p[/C][C]251.769230769231[/C][C][/C][C][/C][/ROW]
[ROW][C]Midmean - Empirical Distribution Function[/C][C]251.769230769231[/C][C][/C][C][/C][/ROW]
[ROW][C]Midmean - Empirical Distribution Function - Averaging[/C][C]251.769230769231[/C][C][/C][C][/C][/ROW]
[ROW][C]Midmean - Empirical Distribution Function - Interpolation[/C][C]251.769230769231[/C][C][/C][C][/C][/ROW]
[ROW][C]Midmean - Closest Observation[/C][C]249.575[/C][C][/C][C][/C][/ROW]
[ROW][C]Midmean - True Basic - Statistics Graphics Toolkit[/C][C]251.769230769231[/C][C][/C][C][/C][/ROW]
[ROW][C]Midmean - MS Excel (old versions)[/C][C]251.769230769231[/C][C][/C][C][/C][/ROW]
[ROW][C]Number of observations[/C][C]77[/C][C][/C][C][/C][/ROW]
[/TABLE]
Source: https://freestatistics.org/blog/index.php?pk=74409&T=1

Globally Unique Identifier (entire table): ba.freestatistics.org/blog/index.php?pk=74409&T=1

As an alternative you can also use a QR Code:  

The GUIDs for individual cells are displayed in the table below:

Central Tendency - Ungrouped Data
MeasureValueS.E.Value/S.E.
Arithmetic Mean294.51948051948122.108356551044413.3216360899321
Geometric Mean236.358840652421
Harmonic Mean183.164793041416
Quadratic Mean351.978637191181
Winsorized Mean ( 1 / 25 )294.16883116883121.921732106520113.4190505448854
Winsorized Mean ( 2 / 25 )290.61038961039020.724053240663614.0228548071943
Winsorized Mean ( 3 / 25 )289.94805194805220.331933609490214.2607219518322
Winsorized Mean ( 4 / 25 )289.89610389610420.278154477521214.2959806434782
Winsorized Mean ( 5 / 25 )289.24675324675320.041184150336414.4326179070561
Winsorized Mean ( 6 / 25 )286.51948051948119.359317880199414.8000814022756
Winsorized Mean ( 7 / 25 )285.61038961039018.949190578934315.0724321664642
Winsorized Mean ( 8 / 25 )285.92207792207818.830373566067415.1840895199930
Winsorized Mean ( 9 / 25 )280.19480519480517.537217907878315.9771525145350
Winsorized Mean ( 10 / 25 )275.38961038961016.337406556379516.8563847290728
Winsorized Mean ( 11 / 25 )275.10389610389616.136609057823317.0484328595989
Winsorized Mean ( 12 / 25 )271.98701298701315.283742557728317.7958384184823
Winsorized Mean ( 13 / 25 )268.94805194805214.562882434687418.4680507553535
Winsorized Mean ( 14 / 25 )273.49350649350713.753674999803319.885122085364
Winsorized Mean ( 15 / 25 )270.96103896103912.933718742313720.9499714938572
Winsorized Mean ( 16 / 25 )263.27272727272711.37020179443123.1546222338530
Winsorized Mean ( 17 / 25 )263.93506493506511.280087550233023.3983170573541
Winsorized Mean ( 18 / 25 )267.67532467532510.790388395958024.8068294534785
Winsorized Mean ( 19 / 25 )254.1038961038968.4615366411378230.0304669093446
Winsorized Mean ( 20 / 25 )253.8441558441568.2804578706656730.6558115274547
Winsorized Mean ( 21 / 25 )251.6623376623387.9758395078057831.5530844641547
Winsorized Mean ( 22 / 25 )249.0909090909097.628376840824432.6531992701071
Winsorized Mean ( 23 / 25 )253.5714285714296.8678928608710536.9212848406707
Winsorized Mean ( 24 / 25 )254.1948051948056.787544354174837.4501869793982
Winsorized Mean ( 25 / 25 )253.870129870136.658251569354938.1286479229151
Trimmed Mean ( 1 / 25 )289.9220.936986196465613.8472651832259
Trimmed Mean ( 2 / 25 )285.43835616438419.752367123056214.4508429995310
Trimmed Mean ( 3 / 25 )282.63380281690119.124312582815614.7787692547373
Trimmed Mean ( 4 / 25 )279.91304347826118.554816591000715.0857348605656
Trimmed Mean ( 5 / 25 )279.91304347826117.889231931600315.6470129376438
Trimmed Mean ( 6 / 25 )274.15384615384617.161930011393715.9745346806470
Trimmed Mean ( 7 / 25 )271.63492063492116.485657649448516.4770448599003
Trimmed Mean ( 8 / 25 )269.11475409836115.772392328366717.0623928504718
Trimmed Mean ( 9 / 25 )266.37288135593214.920045986572217.8533552507589
Trimmed Mean ( 10 / 25 )266.37288135593214.210046326866918.7453914806950
Trimmed Mean ( 11 / 25 )262.74545454545513.629592931905219.2775716676321
Trimmed Mean ( 12 / 25 )261.1132075471712.949372792398720.1641586610622
Trimmed Mean ( 13 / 25 )259.74509803921612.301533242147121.1148555977791
Trimmed Mean ( 14 / 25 )258.63265306122511.655839018672622.1891064767536
Trimmed Mean ( 15 / 25 )256.89361702127711.007029712510723.3390500190336
Trimmed Mean ( 16 / 25 )255.28888888888910.3720010742924.6132725074331
Trimmed Mean ( 17 / 25 )254.3953488372099.9470435868334825.5749707555260
Trimmed Mean ( 18 / 25 )253.3414634146349.4011292624809226.9479821350503
Trimmed Mean ( 19 / 25 )251.7692307692318.7770758288786628.6848644899307
Trimmed Mean ( 20 / 25 )251.7692307692318.5819334659764729.3371221959927
Trimmed Mean ( 21 / 25 )251.2571428571438.3475294847876930.0995813569784
Trimmed Mean ( 22 / 25 )251.2121212121218.0916574106332531.0458177433468
Trimmed Mean ( 23 / 25 )251.4516129032267.8142190096316832.1787260624882
Trimmed Mean ( 24 / 25 )251.2068965517247.627306936869932.9352022451603
Trimmed Mean ( 25 / 25 )250.8518518518527.3517065297412934.1215812732774
Median248
Midrange467
Midmean - Weighted Average at Xnp249.289473684211
Midmean - Weighted Average at X(n+1)p251.769230769231
Midmean - Empirical Distribution Function251.769230769231
Midmean - Empirical Distribution Function - Averaging251.769230769231
Midmean - Empirical Distribution Function - Interpolation251.769230769231
Midmean - Closest Observation249.575
Midmean - True Basic - Statistics Graphics Toolkit251.769230769231
Midmean - MS Excel (old versions)251.769230769231
Number of observations77


Parameters (Session):
Parameters (R input):
R code (references can be found in the software module):
geomean <- function(x) {
return(exp(mean(log(x))))
}
harmean <- function(x) {
return(1/mean(1/x))
}
quamean <- function(x) {
return(sqrt(mean(x*x)))
}
winmean <- function(x) {
x <-sort(x[!is.na(x)])
n<-length(x)
denom <- 3
nodenom <- n/denom
if (nodenom>40) denom <- n/40
sqrtn = sqrt(n)
roundnodenom = floor(nodenom)
win <- array(NA,dim=c(roundnodenom,2))
for (j in 1:roundnodenom) {
win[j,1] <- (j*x[j+1]+sum(x[(j+1):(n-j)])+j*x[n-j])/n
win[j,2] <- sd(c(rep(x[j+1],j),x[(j+1):(n-j)],rep(x[n-j],j)))/sqrtn
}
return(win)
}
trimean <- function(x) {
x <-sort(x[!is.na(x)])
n<-length(x)
denom <- 3
nodenom <- n/denom
if (nodenom>40) denom <- n/40
sqrtn = sqrt(n)
roundnodenom = floor(nodenom)
tri <- array(NA,dim=c(roundnodenom,2))
for (j in 1:roundnodenom) {
tri[j,1] <- mean(x,trim=j/n)
tri[j,2] <- sd(x[(j+1):(n-j)]) / sqrt(n-j*2)
}
return(tri)
}
midrange <- function(x) {
return((max(x)+min(x))/2)
}
q1 <- function(data,n,p,i,f) {
np <- n*p;
i <<- floor(np)
f <<- np - i
qvalue <- (1-f)*data[i] + f*data[i+1]
}
q2 <- function(data,n,p,i,f) {
np <- (n+1)*p
i <<- floor(np)
f <<- np - i
qvalue <- (1-f)*data[i] + f*data[i+1]
}
q3 <- function(data,n,p,i,f) {
np <- n*p
i <<- floor(np)
f <<- np - i
if (f==0) {
qvalue <- data[i]
} else {
qvalue <- data[i+1]
}
}
q4 <- function(data,n,p,i,f) {
np <- n*p
i <<- floor(np)
f <<- np - i
if (f==0) {
qvalue <- (data[i]+data[i+1])/2
} else {
qvalue <- data[i+1]
}
}
q5 <- function(data,n,p,i,f) {
np <- (n-1)*p
i <<- floor(np)
f <<- np - i
if (f==0) {
qvalue <- data[i+1]
} else {
qvalue <- data[i+1] + f*(data[i+2]-data[i+1])
}
}
q6 <- function(data,n,p,i,f) {
np <- n*p+0.5
i <<- floor(np)
f <<- np - i
qvalue <- data[i]
}
q7 <- function(data,n,p,i,f) {
np <- (n+1)*p
i <<- floor(np)
f <<- np - i
if (f==0) {
qvalue <- data[i]
} else {
qvalue <- f*data[i] + (1-f)*data[i+1]
}
}
q8 <- function(data,n,p,i,f) {
np <- (n+1)*p
i <<- floor(np)
f <<- np - i
if (f==0) {
qvalue <- data[i]
} else {
if (f == 0.5) {
qvalue <- (data[i]+data[i+1])/2
} else {
if (f < 0.5) {
qvalue <- data[i]
} else {
qvalue <- data[i+1]
}
}
}
}
midmean <- function(x,def) {
x <-sort(x[!is.na(x)])
n<-length(x)
if (def==1) {
qvalue1 <- q1(x,n,0.25,i,f)
qvalue3 <- q1(x,n,0.75,i,f)
}
if (def==2) {
qvalue1 <- q2(x,n,0.25,i,f)
qvalue3 <- q2(x,n,0.75,i,f)
}
if (def==3) {
qvalue1 <- q3(x,n,0.25,i,f)
qvalue3 <- q3(x,n,0.75,i,f)
}
if (def==4) {
qvalue1 <- q4(x,n,0.25,i,f)
qvalue3 <- q4(x,n,0.75,i,f)
}
if (def==5) {
qvalue1 <- q5(x,n,0.25,i,f)
qvalue3 <- q5(x,n,0.75,i,f)
}
if (def==6) {
qvalue1 <- q6(x,n,0.25,i,f)
qvalue3 <- q6(x,n,0.75,i,f)
}
if (def==7) {
qvalue1 <- q7(x,n,0.25,i,f)
qvalue3 <- q7(x,n,0.75,i,f)
}
if (def==8) {
qvalue1 <- q8(x,n,0.25,i,f)
qvalue3 <- q8(x,n,0.75,i,f)
}
midm <- 0
myn <- 0
roundno4 <- round(n/4)
round3no4 <- round(3*n/4)
for (i in 1:n) {
if ((x[i]>=qvalue1) & (x[i]<=qvalue3)){
midm = midm + x[i]
myn = myn + 1
}
}
midm = midm / myn
return(midm)
}
(arm <- mean(x))
sqrtn <- sqrt(length(x))
(armse <- sd(x) / sqrtn)
(armose <- arm / armse)
(geo <- geomean(x))
(har <- harmean(x))
(qua <- quamean(x))
(win <- winmean(x))
(tri <- trimean(x))
(midr <- midrange(x))
midm <- array(NA,dim=8)
for (j in 1:8) midm[j] <- midmean(x,j)
midm
bitmap(file='test1.png')
lb <- win[,1] - 2*win[,2]
ub <- win[,1] + 2*win[,2]
if ((ylimmin == '') | (ylimmax == '')) plot(win[,1],type='b',main=main, xlab='j', pch=19, ylab='Winsorized Mean(j/n)', ylim=c(min(lb),max(ub))) else plot(win[,1],type='l',main=main, xlab='j', pch=19, ylab='Winsorized Mean(j/n)', ylim=c(ylimmin,ylimmax))
lines(ub,lty=3)
lines(lb,lty=3)
grid()
dev.off()
bitmap(file='test2.png')
lb <- tri[,1] - 2*tri[,2]
ub <- tri[,1] + 2*tri[,2]
if ((ylimmin == '') | (ylimmax == '')) plot(tri[,1],type='b',main=main, xlab='j', pch=19, ylab='Trimmed Mean(j/n)', ylim=c(min(lb),max(ub))) else plot(tri[,1],type='l',main=main, xlab='j', pch=19, ylab='Trimmed Mean(j/n)', ylim=c(ylimmin,ylimmax))
lines(ub,lty=3)
lines(lb,lty=3)
grid()
dev.off()
load(file='createtable')
a<-table.start()
a<-table.row.start(a)
a<-table.element(a,'Central Tendency - Ungrouped Data',4,TRUE)
a<-table.row.end(a)
a<-table.row.start(a)
a<-table.element(a,'Measure',header=TRUE)
a<-table.element(a,'Value',header=TRUE)
a<-table.element(a,'S.E.',header=TRUE)
a<-table.element(a,'Value/S.E.',header=TRUE)
a<-table.row.end(a)
a<-table.row.start(a)
a<-table.element(a,hyperlink('arithmetic_mean.htm', 'Arithmetic Mean', 'click to view the definition of the Arithmetic Mean'),header=TRUE)
a<-table.element(a,arm)
a<-table.element(a,hyperlink('arithmetic_mean_standard_error.htm', armse, 'click to view the definition of the Standard Error of the Arithmetic Mean'))
a<-table.element(a,armose)
a<-table.row.end(a)
a<-table.row.start(a)
a<-table.element(a,hyperlink('geometric_mean.htm', 'Geometric Mean', 'click to view the definition of the Geometric Mean'),header=TRUE)
a<-table.element(a,geo)
a<-table.element(a,'')
a<-table.row.end(a)
a<-table.row.start(a)
a<-table.element(a,hyperlink('harmonic_mean.htm', 'Harmonic Mean', 'click to view the definition of the Harmonic Mean'),header=TRUE)
a<-table.element(a,har)
a<-table.element(a,'')
a<-table.row.end(a)
a<-table.row.start(a)
a<-table.element(a,hyperlink('quadratic_mean.htm', 'Quadratic Mean', 'click to view the definition of the Quadratic Mean'),header=TRUE)
a<-table.element(a,qua)
a<-table.element(a,'')
a<-table.row.end(a)
for (j in 1:length(win[,1])) {
a<-table.row.start(a)
mylabel <- paste('Winsorized Mean (',j)
mylabel <- paste(mylabel,'/')
mylabel <- paste(mylabel,length(win[,1]))
mylabel <- paste(mylabel,')')
a<-table.element(a,hyperlink('winsorized_mean.htm', mylabel, 'click to view the definition of the Winsorized Mean'),header=TRUE)
a<-table.element(a,win[j,1])
a<-table.element(a,win[j,2])
a<-table.element(a,win[j,1]/win[j,2])
a<-table.row.end(a)
}
for (j in 1:length(tri[,1])) {
a<-table.row.start(a)
mylabel <- paste('Trimmed Mean (',j)
mylabel <- paste(mylabel,'/')
mylabel <- paste(mylabel,length(tri[,1]))
mylabel <- paste(mylabel,')')
a<-table.element(a,hyperlink('arithmetic_mean.htm', mylabel, 'click to view the definition of the Trimmed Mean'),header=TRUE)
a<-table.element(a,tri[j,1])
a<-table.element(a,tri[j,2])
a<-table.element(a,tri[j,1]/tri[j,2])
a<-table.row.end(a)
}
a<-table.row.start(a)
a<-table.element(a,hyperlink('median_1.htm', 'Median', 'click to view the definition of the Median'),header=TRUE)
a<-table.element(a,median(x))
a<-table.element(a,'')
a<-table.row.end(a)
a<-table.row.start(a)
a<-table.element(a,hyperlink('midrange.htm', 'Midrange', 'click to view the definition of the Midrange'),header=TRUE)
a<-table.element(a,midr)
a<-table.element(a,'')
a<-table.row.end(a)
a<-table.row.start(a)
mymid <- hyperlink('midmean.htm', 'Midmean', 'click to view the definition of the Midmean')
mylabel <- paste(mymid,hyperlink('method_1.htm','Weighted Average at Xnp',''),sep=' - ')
a<-table.element(a,mylabel,header=TRUE)
a<-table.element(a,midm[1])
a<-table.element(a,'')
a<-table.row.end(a)
a<-table.row.start(a)
mymid <- hyperlink('midmean.htm', 'Midmean', 'click to view the definition of the Midmean')
mylabel <- paste(mymid,hyperlink('method_2.htm','Weighted Average at X(n+1)p',''),sep=' - ')
a<-table.element(a,mylabel,header=TRUE)
a<-table.element(a,midm[2])
a<-table.element(a,'')
a<-table.row.end(a)
a<-table.row.start(a)
mymid <- hyperlink('midmean.htm', 'Midmean', 'click to view the definition of the Midmean')
mylabel <- paste(mymid,hyperlink('method_3.htm','Empirical Distribution Function',''),sep=' - ')
a<-table.element(a,mylabel,header=TRUE)
a<-table.element(a,midm[3])
a<-table.element(a,'')
a<-table.row.end(a)
a<-table.row.start(a)
mymid <- hyperlink('midmean.htm', 'Midmean', 'click to view the definition of the Midmean')
mylabel <- paste(mymid,hyperlink('method_4.htm','Empirical Distribution Function - Averaging',''),sep=' - ')
a<-table.element(a,mylabel,header=TRUE)
a<-table.element(a,midm[4])
a<-table.element(a,'')
a<-table.row.end(a)
a<-table.row.start(a)
mymid <- hyperlink('midmean.htm', 'Midmean', 'click to view the definition of the Midmean')
mylabel <- paste(mymid,hyperlink('method_5.htm','Empirical Distribution Function - Interpolation',''),sep=' - ')
a<-table.element(a,mylabel,header=TRUE)
a<-table.element(a,midm[5])
a<-table.element(a,'')
a<-table.row.end(a)
a<-table.row.start(a)
mymid <- hyperlink('midmean.htm', 'Midmean', 'click to view the definition of the Midmean')
mylabel <- paste(mymid,hyperlink('method_6.htm','Closest Observation',''),sep=' - ')
a<-table.element(a,mylabel,header=TRUE)
a<-table.element(a,midm[6])
a<-table.element(a,'')
a<-table.row.end(a)
a<-table.row.start(a)
mymid <- hyperlink('midmean.htm', 'Midmean', 'click to view the definition of the Midmean')
mylabel <- paste(mymid,hyperlink('method_7.htm','True Basic - Statistics Graphics Toolkit',''),sep=' - ')
a<-table.element(a,mylabel,header=TRUE)
a<-table.element(a,midm[7])
a<-table.element(a,'')
a<-table.row.end(a)
a<-table.row.start(a)
mymid <- hyperlink('midmean.htm', 'Midmean', 'click to view the definition of the Midmean')
mylabel <- paste(mymid,hyperlink('method_8.htm','MS Excel (old versions)',''),sep=' - ')
a<-table.element(a,mylabel,header=TRUE)
a<-table.element(a,midm[8])
a<-table.element(a,'')
a<-table.row.end(a)
a<-table.row.start(a)
a<-table.element(a,'Number of observations',header=TRUE)
a<-table.element(a,length(x))
a<-table.element(a,'')
a<-table.row.end(a)
a<-table.end(a)
table.save(a,file='mytable.tab')