| *The author of this computation has been verified* | ||||||||||||||||||||||||||||||||||||||||||||||||||||||||||||||||||||||||||||||||||||||||||||||||||||||||||||||||||||||||||||||||||||||||||||||||||||||||||||||||||||||||||||||||||||||||||||||||||||||||||||||||||
| R Software Module: /rwasp_arimabackwardselection.wasp (opens new window with default values) | ||||||||||||||||||||||||||||||||||||||||||||||||||||||||||||||||||||||||||||||||||||||||||||||||||||||||||||||||||||||||||||||||||||||||||||||||||||||||||||||||||||||||||||||||||||||||||||||||||||||||||||||||||
| Title produced by software: ARIMA Backward Selection | ||||||||||||||||||||||||||||||||||||||||||||||||||||||||||||||||||||||||||||||||||||||||||||||||||||||||||||||||||||||||||||||||||||||||||||||||||||||||||||||||||||||||||||||||||||||||||||||||||||||||||||||||||
| Date of computation: Wed, 29 Dec 2010 13:27:55 +0000 | ||||||||||||||||||||||||||||||||||||||||||||||||||||||||||||||||||||||||||||||||||||||||||||||||||||||||||||||||||||||||||||||||||||||||||||||||||||||||||||||||||||||||||||||||||||||||||||||||||||||||||||||||||
| Cite this page as follows: | ||||||||||||||||||||||||||||||||||||||||||||||||||||||||||||||||||||||||||||||||||||||||||||||||||||||||||||||||||||||||||||||||||||||||||||||||||||||||||||||||||||||||||||||||||||||||||||||||||||||||||||||||||
| Statistical Computations at FreeStatistics.org, Office for Research Development and Education, URL http://www.freestatistics.org/blog/date/2010/Dec/29/t1293629143era9lmutrkpq1vk.htm/, Retrieved Wed, 29 Dec 2010 14:25:43 +0100 | ||||||||||||||||||||||||||||||||||||||||||||||||||||||||||||||||||||||||||||||||||||||||||||||||||||||||||||||||||||||||||||||||||||||||||||||||||||||||||||||||||||||||||||||||||||||||||||||||||||||||||||||||||
| BibTeX entries for LaTeX users: | ||||||||||||||||||||||||||||||||||||||||||||||||||||||||||||||||||||||||||||||||||||||||||||||||||||||||||||||||||||||||||||||||||||||||||||||||||||||||||||||||||||||||||||||||||||||||||||||||||||||||||||||||||
@Manual{KEY,
    author = {{YOUR NAME}},
    publisher = {Office for Research Development and Education},
    title = {Statistical Computations at FreeStatistics.org, URL http://www.freestatistics.org/blog/date/2010/Dec/29/t1293629143era9lmutrkpq1vk.htm/},
    year = {2010},
}
@Manual{R,
    title = {R: A Language and Environment for Statistical Computing},
    author = {{R Development Core Team}},
    organization = {R Foundation for Statistical Computing},
    address = {Vienna, Austria},
    year = {2010},
    note = {{ISBN} 3-900051-07-0},
    url = {http://www.R-project.org},
}
| ||||||||||||||||||||||||||||||||||||||||||||||||||||||||||||||||||||||||||||||||||||||||||||||||||||||||||||||||||||||||||||||||||||||||||||||||||||||||||||||||||||||||||||||||||||||||||||||||||||||||||||||||||
| Original text written by user: | ||||||||||||||||||||||||||||||||||||||||||||||||||||||||||||||||||||||||||||||||||||||||||||||||||||||||||||||||||||||||||||||||||||||||||||||||||||||||||||||||||||||||||||||||||||||||||||||||||||||||||||||||||
| IsPrivate? | ||||||||||||||||||||||||||||||||||||||||||||||||||||||||||||||||||||||||||||||||||||||||||||||||||||||||||||||||||||||||||||||||||||||||||||||||||||||||||||||||||||||||||||||||||||||||||||||||||||||||||||||||||
| No (this computation is public) | ||||||||||||||||||||||||||||||||||||||||||||||||||||||||||||||||||||||||||||||||||||||||||||||||||||||||||||||||||||||||||||||||||||||||||||||||||||||||||||||||||||||||||||||||||||||||||||||||||||||||||||||||||
| User-defined keywords: | ||||||||||||||||||||||||||||||||||||||||||||||||||||||||||||||||||||||||||||||||||||||||||||||||||||||||||||||||||||||||||||||||||||||||||||||||||||||||||||||||||||||||||||||||||||||||||||||||||||||||||||||||||
| Dataseries X: | ||||||||||||||||||||||||||||||||||||||||||||||||||||||||||||||||||||||||||||||||||||||||||||||||||||||||||||||||||||||||||||||||||||||||||||||||||||||||||||||||||||||||||||||||||||||||||||||||||||||||||||||||||
| » Textbox « » Textfile « » CSV « | ||||||||||||||||||||||||||||||||||||||||||||||||||||||||||||||||||||||||||||||||||||||||||||||||||||||||||||||||||||||||||||||||||||||||||||||||||||||||||||||||||||||||||||||||||||||||||||||||||||||||||||||||||
| 00,521505 00,424828 00,425031 00,477194 00,828021 00,615619 00,366627 00,430888 00,281029 00,464625 00,269395 00,577905 00,566115 00,507758 00,750718 00,680840 00,766109 00,456147 00,497750 00,419327 00,609551 00,457337 00,570548 00,347900 00,387499 00,582429 00,239103 00,236745 00,262616 00,424093 00,365275 00,375076 00,409006 00,389168 00,240261 00,158950 00,439337 00,509468 00,374347 00,433983 00,413056 00,328893 00,518665 00,548650 00,546911 00,496349 00,530893 00,595776 00,557058 00,573133 00,500542 00,543127 00,559366 00,691169 00,440349 00,567666 00,596911 00,473554 00,592394 00,597556 00,633413 00,605712 00,704611 00,480526 00,702686 00,700902 00,603085 00,698092 00,597656 00,802342 00,601711 00,599313 00,602563 00,701663 00,499571 00,498092 00,497569 00,600183 00,333954 00,274437 00,320943 00,540667 00,405021 00,288596 00,327594 00,313261 00,257556 00,213839 00,186186 00,159271 | ||||||||||||||||||||||||||||||||||||||||||||||||||||||||||||||||||||||||||||||||||||||||||||||||||||||||||||||||||||||||||||||||||||||||||||||||||||||||||||||||||||||||||||||||||||||||||||||||||||||||||||||||||
| Output produced by software: | ||||||||||||||||||||||||||||||||||||||||||||||||||||||||||||||||||||||||||||||||||||||||||||||||||||||||||||||||||||||||||||||||||||||||||||||||||||||||||||||||||||||||||||||||||||||||||||||||||||||||||||||||||
| ||||||||||||||||||||||||||||||||||||||||||||||||||||||||||||||||||||||||||||||||||||||||||||||||||||||||||||||||||||||||||||||||||||||||||||||||||||||||||||||||||||||||||||||||||||||||||||||||||||||||||||||||||
| Charts produced by software: | ||||||||||||||||||||||||||||||||||||||||||||||||||||||||||||||||||||||||||||||||||||||||||||||||||||||||||||||||||||||||||||||||||||||||||||||||||||||||||||||||||||||||||||||||||||||||||||||||||||||||||||||||||
| ||||||||||||||||||||||||||||||||||||||||||||||||||||||||||||||||||||||||||||||||||||||||||||||||||||||||||||||||||||||||||||||||||||||||||||||||||||||||||||||||||||||||||||||||||||||||||||||||||||||||||||||||||
| Parameters (Session): | ||||||||||||||||||||||||||||||||||||||||||||||||||||||||||||||||||||||||||||||||||||||||||||||||||||||||||||||||||||||||||||||||||||||||||||||||||||||||||||||||||||||||||||||||||||||||||||||||||||||||||||||||||
| par1 = FALSE ; par2 = 1 ; par3 = 1 ; par4 = 1 ; par5 = 12 ; par6 = 3 ; par7 = 1 ; par8 = 0 ; par9 = 1 ; | ||||||||||||||||||||||||||||||||||||||||||||||||||||||||||||||||||||||||||||||||||||||||||||||||||||||||||||||||||||||||||||||||||||||||||||||||||||||||||||||||||||||||||||||||||||||||||||||||||||||||||||||||||
| Parameters (R input): | ||||||||||||||||||||||||||||||||||||||||||||||||||||||||||||||||||||||||||||||||||||||||||||||||||||||||||||||||||||||||||||||||||||||||||||||||||||||||||||||||||||||||||||||||||||||||||||||||||||||||||||||||||
| par1 = FALSE ; par2 = 1 ; par3 = 1 ; par4 = 1 ; par5 = 12 ; par6 = 3 ; par7 = 1 ; par8 = 0 ; par9 = 1 ; | ||||||||||||||||||||||||||||||||||||||||||||||||||||||||||||||||||||||||||||||||||||||||||||||||||||||||||||||||||||||||||||||||||||||||||||||||||||||||||||||||||||||||||||||||||||||||||||||||||||||||||||||||||
| R code (references can be found in the software module): | ||||||||||||||||||||||||||||||||||||||||||||||||||||||||||||||||||||||||||||||||||||||||||||||||||||||||||||||||||||||||||||||||||||||||||||||||||||||||||||||||||||||||||||||||||||||||||||||||||||||||||||||||||
| library(lattice)
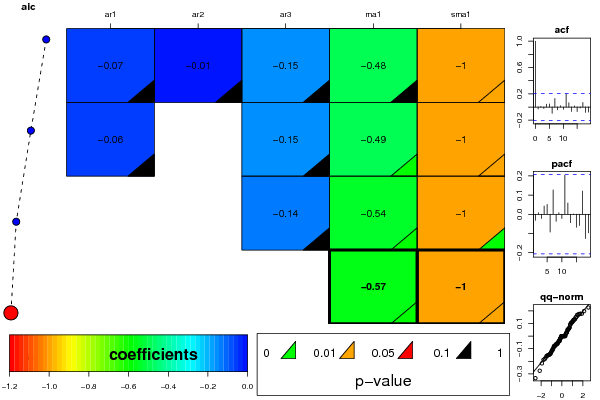
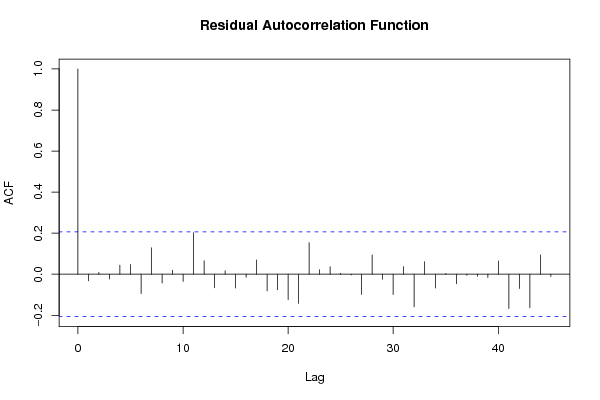
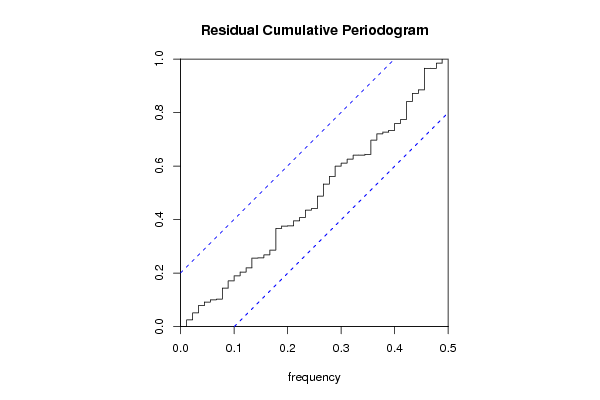
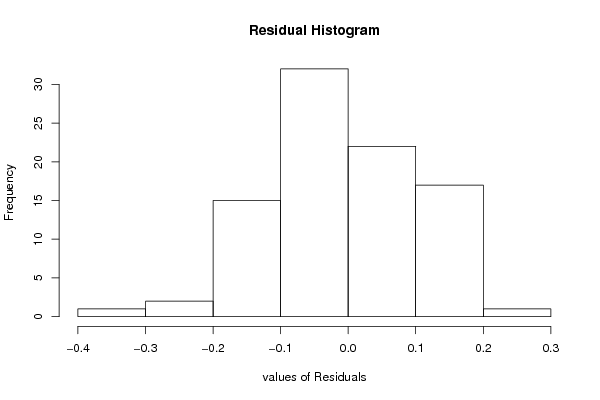
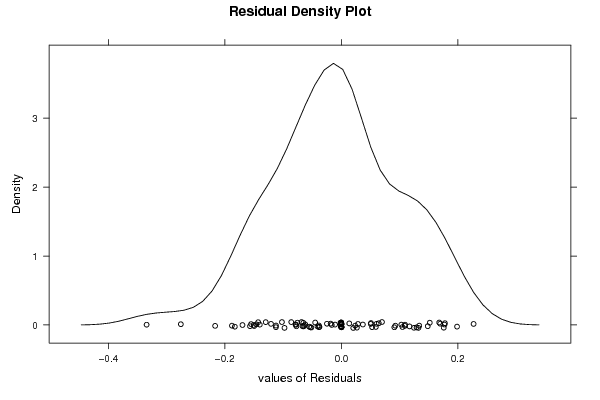
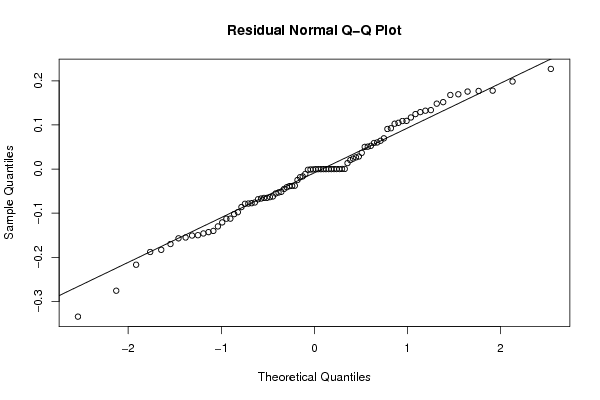
if (par1 == 'TRUE') par1 <- TRUE if (par1 == 'FALSE') par1 <- FALSE par2 <- as.numeric(par2) #Box-Cox lambda transformation parameter par3 <- as.numeric(par3) #degree of non-seasonal differencing par4 <- as.numeric(par4) #degree of seasonal differencing par5 <- as.numeric(par5) #seasonal period par6 <- as.numeric(par6) #degree (p) of the non-seasonal AR(p) polynomial par7 <- as.numeric(par7) #degree (q) of the non-seasonal MA(q) polynomial par8 <- as.numeric(par8) #degree (P) of the seasonal AR(P) polynomial par9 <- as.numeric(par9) #degree (Q) of the seasonal MA(Q) polynomial armaGR <- function(arima.out, names, n){ try1 <- arima.out$coef try2 <- sqrt(diag(arima.out$var.coef)) try.data.frame <- data.frame(matrix(NA,ncol=4,nrow=length(names))) dimnames(try.data.frame) <- list(names,c('coef','std','tstat','pv')) try.data.frame[,1] <- try1 for(i in 1:length(try2)) try.data.frame[which(rownames(try.data.frame)==names(try2)[i]),2] <- try2[i] try.data.frame[,3] <- try.data.frame[,1] / try.data.frame[,2] try.data.frame[,4] <- round((1-pt(abs(try.data.frame[,3]),df=n-(length(try2)+1)))*2,5) vector <- rep(NA,length(names)) vector[is.na(try.data.frame[,4])] <- 0 maxi <- which.max(try.data.frame[,4]) continue <- max(try.data.frame[,4],na.rm=TRUE) > .05 vector[maxi] <- 0 list(summary=try.data.frame,next.vector=vector,continue=continue) } arimaSelect <- function(series, order=c(13,0,0), seasonal=list(order=c(2,0,0),period=12), include.mean=F){ nrc <- order[1]+order[3]+seasonal$order[1]+seasonal$order[3] coeff <- matrix(NA, nrow=nrc*2, ncol=nrc) pval <- matrix(NA, nrow=nrc*2, ncol=nrc) mylist <- rep(list(NULL), nrc) names <- NULL if(order[1] > 0) names <- paste('ar',1:order[1],sep='') if(order[3] > 0) names <- c( names , paste('ma',1:order[3],sep='') ) if(seasonal$order[1] > 0) names <- c(names, paste('sar',1:seasonal$order[1],sep='')) if(seasonal$order[3] > 0) names <- c(names, paste('sma',1:seasonal$order[3],sep='')) arima.out <- arima(series, order=order, seasonal=seasonal, include.mean=include.mean, method='ML') mylist[[1]] <- arima.out last.arma <- armaGR(arima.out, names, length(series)) mystop <- FALSE i <- 1 coeff[i,] <- last.arma[[1]][,1] pval [i,] <- last.arma[[1]][,4] i <- 2 aic <- arima.out$aic while(!mystop){ mylist[[i]] <- arima.out arima.out <- arima(series, order=order, seasonal=seasonal, include.mean=include.mean, method='ML', fixed=last.arma$next.vector) aic <- c(aic, arima.out$aic) last.arma <- armaGR(arima.out, names, length(series)) mystop <- !last.arma$continue coeff[i,] <- last.arma[[1]][,1] pval [i,] <- last.arma[[1]][,4] i <- i+1 } list(coeff, pval, mylist, aic=aic) } arimaSelectplot <- function(arimaSelect.out,noms,choix){ noms <- names(arimaSelect.out[[3]][[1]]$coef) coeff <- arimaSelect.out[[1]] k <- min(which(is.na(coeff[,1])))-1 coeff <- coeff[1:k,] pval <- arimaSelect.out[[2]][1:k,] aic <- arimaSelect.out$aic[1:k] coeff[coeff==0] <- NA n <- ncol(coeff) if(missing(choix)) choix <- k layout(matrix(c(1,1,1,2, 3,3,3,2, 3,3,3,4, 5,6,7,7),nr=4), widths=c(10,35,45,15), heights=c(30,30,15,15)) couleurs <- rainbow(75)[1:50]#(50) ticks <- pretty(coeff) par(mar=c(1,1,3,1)) plot(aic,k:1-.5,type='o',pch=21,bg='blue',cex=2,axes=F,lty=2,xpd=NA) points(aic[choix],k-choix+.5,pch=21,cex=4,bg=2,xpd=NA) title('aic',line=2) par(mar=c(3,0,0,0)) plot(0,axes=F,xlab='',ylab='',xlim=range(ticks),ylim=c(.1,1)) rect(xleft = min(ticks) + (0:49)/50*(max(ticks)-min(ticks)), xright = min(ticks) + (1:50)/50*(max(ticks)-min(ticks)), ytop = rep(1,50), ybottom= rep(0,50),col=couleurs,border=NA) axis(1,ticks) rect(xleft=min(ticks),xright=max(ticks),ytop=1,ybottom=0) text(mean(coeff,na.rm=T),.5,'coefficients',cex=2,font=2) par(mar=c(1,1,3,1)) image(1:n,1:k,t(coeff[k:1,]),axes=F,col=couleurs,zlim=range(ticks)) for(i in 1:n) for(j in 1:k) if(!is.na(coeff[j,i])) { if(pval[j,i]<.01) symb = 'green' else if( (pval[j,i]<.05) & (pval[j,i]>=.01)) symb = 'orange' else if( (pval[j,i]<.1) & (pval[j,i]>=.05)) symb = 'red' else symb = 'black' polygon(c(i+.5 ,i+.2 ,i+.5 ,i+.5), c(k-j+0.5,k-j+0.5,k-j+0.8,k-j+0.5), col=symb) if(j==choix) { rect(xleft=i-.5, xright=i+.5, ybottom=k-j+1.5, ytop=k-j+.5, lwd=4) text(i, k-j+1, round(coeff[j,i],2), cex=1.2, font=2) } else{ rect(xleft=i-.5,xright=i+.5,ybottom=k-j+1.5,ytop=k-j+.5) text(i,k-j+1,round(coeff[j,i],2),cex=1.2,font=1) } } axis(3,1:n,noms) par(mar=c(0.5,0,0,0.5)) plot(0,axes=F,xlab='',ylab='',type='n',xlim=c(0,8),ylim=c(-.2,.8)) cols <- c('green','orange','red','black') niv <- c('0','0.01','0.05','0.1') for(i in 0:3){ polygon(c(1+2*i ,1+2*i ,1+2*i-.5 ,1+2*i), c(.4 ,.7 , .4 , .4), col=cols[i+1]) text(2*i,0.5,niv[i+1],cex=1.5) } text(8,.5,1,cex=1.5) text(4,0,'p-value',cex=2) box() residus <- arimaSelect.out[[3]][[choix]]$res par(mar=c(1,2,4,1)) acf(residus,main='') title('acf',line=.5) par(mar=c(1,2,4,1)) pacf(residus,main='') title('pacf',line=.5) par(mar=c(2,2,4,1)) qqnorm(residus,main='') title('qq-norm',line=.5) qqline(residus) residus } if (par2 == 0) x <- log(x) if (par2 != 0) x <- x^par2 (selection <- arimaSelect(x, order=c(par6,par3,par7), seasonal=list(order=c(par8,par4,par9), period=par5))) bitmap(file='test1.png') resid <- arimaSelectplot(selection) dev.off() resid bitmap(file='test2.png') acf(resid,length(resid)/2, main='Residual Autocorrelation Function') dev.off() bitmap(file='test3.png') pacf(resid,length(resid)/2, main='Residual Partial Autocorrelation Function') dev.off() bitmap(file='test4.png') cpgram(resid, main='Residual Cumulative Periodogram') dev.off() bitmap(file='test5.png') hist(resid, main='Residual Histogram', xlab='values of Residuals') dev.off() bitmap(file='test6.png') densityplot(~resid,col='black',main='Residual Density Plot', xlab='values of Residuals') dev.off() bitmap(file='test7.png') qqnorm(resid, main='Residual Normal Q-Q Plot') qqline(resid) dev.off() ncols <- length(selection[[1]][1,]) nrows <- length(selection[[2]][,1])-1 load(file='createtable') a<-table.start() a<-table.row.start(a) a<-table.element(a,'ARIMA Parameter Estimation and Backward Selection', ncols+1,TRUE) a<-table.row.end(a) a<-table.row.start(a) a<-table.element(a,'Iteration', header=TRUE) for (i in 1:ncols) { a<-table.element(a,names(selection[[3]][[1]]$coef)[i],header=TRUE) } a<-table.row.end(a) for (j in 1:nrows) { a<-table.row.start(a) mydum <- 'Estimates (' mydum <- paste(mydum,j) mydum <- paste(mydum,')') a<-table.element(a,mydum, header=TRUE) for (i in 1:ncols) { a<-table.element(a,round(selection[[1]][j,i],4)) } a<-table.row.end(a) a<-table.row.start(a) a<-table.element(a,'(p-val)', header=TRUE) for (i in 1:ncols) { mydum <- '(' mydum <- paste(mydum,round(selection[[2]][j,i],4),sep='') mydum <- paste(mydum,')') a<-table.element(a,mydum) } a<-table.row.end(a) } a<-table.end(a) table.save(a,file='mytable.tab') a<-table.start() a<-table.row.start(a) a<-table.element(a,'Estimated ARIMA Residuals', 1,TRUE) a<-table.row.end(a) a<-table.row.start(a) a<-table.element(a,'Value', 1,TRUE) a<-table.row.end(a) for (i in (par4*par5+par3):length(resid)) { a<-table.row.start(a) a<-table.element(a,resid[i]) a<-table.row.end(a) } a<-table.end(a) table.save(a,file='mytable1.tab') | ||||||||||||||||||||||||||||||||||||||||||||||||||||||||||||||||||||||||||||||||||||||||||||||||||||||||||||||||||||||||||||||||||||||||||||||||||||||||||||||||||||||||||||||||||||||||||||||||||||||||||||||||||

Copyright

This work is licensed under a
Creative Commons Attribution-Noncommercial-Share Alike 3.0 License.
Software written by Ed van Stee & Patrick Wessa
Disclaimer
Information provided on this web site is provided "AS IS" without warranty of any kind, either express or implied, including, without limitation, warranties of merchantability, fitness for a particular purpose, and noninfringement. We use reasonable efforts to include accurate and timely information and periodically update the information, and software without notice. However, we make no warranties or representations as to the accuracy or completeness of such information (or software), and we assume no liability or responsibility for errors or omissions in the content of this web site, or any software bugs in online applications. Your use of this web site is AT YOUR OWN RISK. Under no circumstances and under no legal theory shall we be liable to you or any other person for any direct, indirect, special, incidental, exemplary, or consequential damages arising from your access to, or use of, this web site.
Privacy Policy
We may request personal information to be submitted to our servers in order to be able to:
- personalize online software applications according to your needs
- enforce strict security rules with respect to the data that you upload (e.g. statistical data)
- manage user sessions of online applications
- alert you about important changes or upgrades in resources or applications
We NEVER allow other companies to directly offer registered users information about their products and services. Banner references and hyperlinks of third parties NEVER contain any personal data of the visitor.
We do NOT sell, nor transmit by any means, personal information, nor statistical data series uploaded by you to third parties.
We carefully protect your data from loss, misuse, alteration,
and destruction. However, at any time, and under any circumstance you
are solely responsible for managing your passwords, and keeping them
secret.
We store a unique ANONYMOUS USER ID in the form of a small 'Cookie' on your computer. This allows us to track your progress when using this website which is necessary to create state-dependent features. The cookie is used for NO OTHER PURPOSE. At any time you may opt to disallow cookies from this website - this will not affect other features of this website.
We examine cookies that are used by third-parties (banner and online ads) very closely: abuse from third-parties automatically results in termination of the advertising contract without refund. We have very good reason to believe that the cookies that are produced by third parties (banner ads) do NOT cause any privacy or security risk.
FreeStatistics.org is safe. There is no need to download any software to use the applications and services contained in this website. Hence, your system's security is not compromised by their use, and your personal data - other than data you submit in the account application form, and the user-agent information that is transmitted by your browser - is never transmitted to our servers.
As a general rule, we do not log on-line behavior of individuals (other than normal logging of webserver 'hits'). However, in cases of abuse, hacking, unauthorized access, Denial of Service attacks, illegal copying, hotlinking, non-compliance with international webstandards (such as robots.txt), or any other harmful behavior, our system engineers are empowered to log, track, identify, publish, and ban misbehaving individuals - even if this leads to ban entire blocks of IP addresses, or disclosing user's identity.