| *The author of this computation has been verified* | |||||||||||||||||||||
| R Software Module: /rwasp_meanplot.wasp (opens new window with default values) | |||||||||||||||||||||
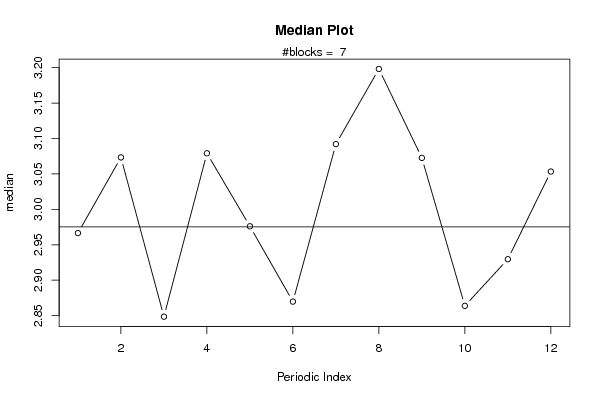
| Title produced by software: Mean Plot | |||||||||||||||||||||
| Date of computation: Wed, 29 Dec 2010 12:11:33 +0000 | |||||||||||||||||||||
| Cite this page as follows: | |||||||||||||||||||||
| Statistical Computations at FreeStatistics.org, Office for Research Development and Education, URL http://www.freestatistics.org/blog/date/2010/Dec/29/t1293624557on2dkhs8rxggz10.htm/, Retrieved Wed, 29 Dec 2010 13:09:25 +0100 | |||||||||||||||||||||
| BibTeX entries for LaTeX users: | |||||||||||||||||||||
@Manual{KEY,
    author = {{YOUR NAME}},
    publisher = {Office for Research Development and Education},
    title = {Statistical Computations at FreeStatistics.org, URL http://www.freestatistics.org/blog/date/2010/Dec/29/t1293624557on2dkhs8rxggz10.htm/},
    year = {2010},
}
@Manual{R,
    title = {R: A Language and Environment for Statistical Computing},
    author = {{R Development Core Team}},
    organization = {R Foundation for Statistical Computing},
    address = {Vienna, Austria},
    year = {2010},
    note = {{ISBN} 3-900051-07-0},
    url = {http://www.R-project.org},
}
| |||||||||||||||||||||
| Original text written by user: | |||||||||||||||||||||
| IsPrivate? | |||||||||||||||||||||
| No (this computation is public) | |||||||||||||||||||||
| User-defined keywords: | |||||||||||||||||||||
| Dataseries X: | |||||||||||||||||||||
| » Textbox « » Textfile « » CSV « | |||||||||||||||||||||
| 04,031636 03,702076 03,056167 03,280707 02,984728 03,693712 03,226317 02,190349 02,599515 03,080288 02,929672 02,922548 03,234943 02,983081 03,284389 03,806511 03,784579 02,645654 03,092081 03,204859 03,107225 03,466909 02,984404 03,218072 02,827310 03,182049 02,236319 02,033218 01,644804 01,627971 01,677559 02,330828 02,493615 02,257172 02,655517 02,298655 02,600402 03,045230 02,790583 03,227052 02,967479 02,938817 03,277961 03,423985 03,072646 02,754253 02,910431 03,174369 03,068387 03,089543 02,906654 02,931161 03,025660 02,939551 02,691019 03,198120 03,076390 02,863873 03,013802 03,053364 02,864753 03,057062 02,959365 03,252258 03,602988 03,497704 03,296867 03,602417 03,300100 03,401930 03,502591 03,402348 03,498551 03,199823 02,700064 02,801034 02,898628 02,800854 02,399942 02,402724 02,202331 02,102594 01,798293 01,202484 01,400201 01,200832 01,298083 01,099742 01,001377 00,836174 | |||||||||||||||||||||
| Output produced by software: | |||||||||||||||||||||
| |||||||||||||||||||||
| Charts produced by software: | |||||||||||||||||||||
| |||||||||||||||||||||
| Parameters (Session): | |||||||||||||||||||||
| par1 = 12 ; | |||||||||||||||||||||
| Parameters (R input): | |||||||||||||||||||||
| par1 = 12 ; | |||||||||||||||||||||
| R code (references can be found in the software module): | |||||||||||||||||||||
| par1 <- as.numeric(par1)
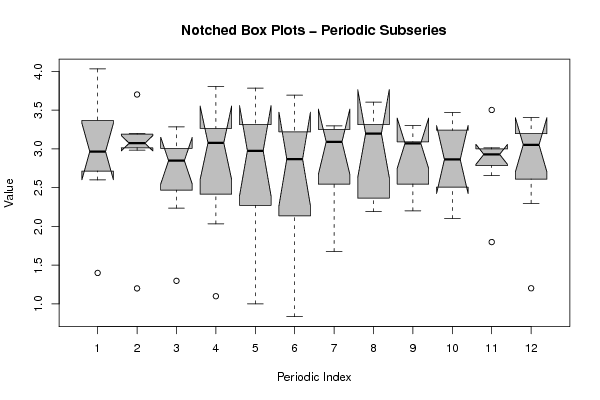
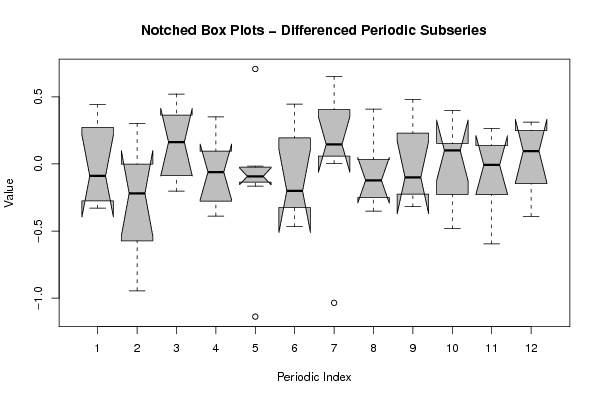
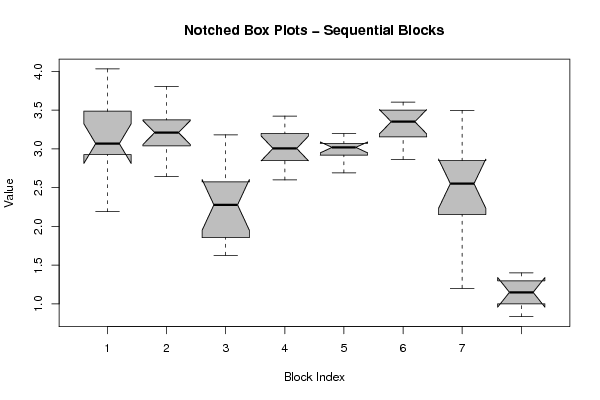
(n <- length(x)) (np <- floor(n / par1)) arr <- array(NA,dim=c(par1,np+1)) darr <- array(NA,dim=c(par1,np+1)) ari <- array(0,dim=par1) dx <- diff(x) j <- 0 for (i in 1:n) { j = j + 1 ari[j] = ari[j] + 1 arr[j,ari[j]] <- x[i] darr[j,ari[j]] <- dx[i] if (j == par1) j = 0 } ari arr darr arr.mean <- array(NA,dim=par1) arr.median <- array(NA,dim=par1) arr.midrange <- array(NA,dim=par1) for (j in 1:par1) { arr.mean[j] <- mean(arr[j,],na.rm=TRUE) arr.median[j] <- median(arr[j,],na.rm=TRUE) arr.midrange[j] <- (quantile(arr[j,],0.75,na.rm=TRUE) + quantile(arr[j,],0.25,na.rm=TRUE)) / 2 } overall.mean <- mean(x) overall.median <- median(x) overall.midrange <- (quantile(x,0.75) + quantile(x,0.25)) / 2 bitmap(file='plot1.png') plot(arr.mean,type='b',ylab='mean',main='Mean Plot',xlab='Periodic Index') mtext(paste('#blocks = ',np)) abline(overall.mean,0) dev.off() bitmap(file='plot2.png') plot(arr.median,type='b',ylab='median',main='Median Plot',xlab='Periodic Index') mtext(paste('#blocks = ',np)) abline(overall.median,0) dev.off() bitmap(file='plot3.png') plot(arr.midrange,type='b',ylab='midrange',main='Midrange Plot',xlab='Periodic Index') mtext(paste('#blocks = ',np)) abline(overall.midrange,0) dev.off() bitmap(file='plot4.png') z <- data.frame(t(arr)) names(z) <- c(1:par1) (boxplot(z,notch=TRUE,col='grey',xlab='Periodic Index',ylab='Value',main='Notched Box Plots - Periodic Subseries')) dev.off() bitmap(file='plot4b.png') z <- data.frame(t(darr)) names(z) <- c(1:par1) (boxplot(z,notch=TRUE,col='grey',xlab='Periodic Index',ylab='Value',main='Notched Box Plots - Differenced Periodic Subseries')) dev.off() bitmap(file='plot5.png') z <- data.frame(arr) names(z) <- c(1:np) (boxplot(z,notch=TRUE,col='grey',xlab='Block Index',ylab='Value',main='Notched Box Plots - Sequential Blocks')) dev.off() bitmap(file='plot6.png') z <- data.frame(cbind(arr.mean,arr.median,arr.midrange)) names(z) <- list('mean','median','midrange') (boxplot(z,notch=TRUE,col='grey',ylab='Overall Central Tendency',main='Notched Box Plots')) dev.off() | |||||||||||||||||||||


Copyright

This work is licensed under a
Creative Commons Attribution-Noncommercial-Share Alike 3.0 License.
Software written by Ed van Stee & Patrick Wessa
Disclaimer
Information provided on this web site is provided "AS IS" without warranty of any kind, either express or implied, including, without limitation, warranties of merchantability, fitness for a particular purpose, and noninfringement. We use reasonable efforts to include accurate and timely information and periodically update the information, and software without notice. However, we make no warranties or representations as to the accuracy or completeness of such information (or software), and we assume no liability or responsibility for errors or omissions in the content of this web site, or any software bugs in online applications. Your use of this web site is AT YOUR OWN RISK. Under no circumstances and under no legal theory shall we be liable to you or any other person for any direct, indirect, special, incidental, exemplary, or consequential damages arising from your access to, or use of, this web site.
Privacy Policy
We may request personal information to be submitted to our servers in order to be able to:
- personalize online software applications according to your needs
- enforce strict security rules with respect to the data that you upload (e.g. statistical data)
- manage user sessions of online applications
- alert you about important changes or upgrades in resources or applications
We NEVER allow other companies to directly offer registered users information about their products and services. Banner references and hyperlinks of third parties NEVER contain any personal data of the visitor.
We do NOT sell, nor transmit by any means, personal information, nor statistical data series uploaded by you to third parties.
We carefully protect your data from loss, misuse, alteration,
and destruction. However, at any time, and under any circumstance you
are solely responsible for managing your passwords, and keeping them
secret.
We store a unique ANONYMOUS USER ID in the form of a small 'Cookie' on your computer. This allows us to track your progress when using this website which is necessary to create state-dependent features. The cookie is used for NO OTHER PURPOSE. At any time you may opt to disallow cookies from this website - this will not affect other features of this website.
We examine cookies that are used by third-parties (banner and online ads) very closely: abuse from third-parties automatically results in termination of the advertising contract without refund. We have very good reason to believe that the cookies that are produced by third parties (banner ads) do NOT cause any privacy or security risk.
FreeStatistics.org is safe. There is no need to download any software to use the applications and services contained in this website. Hence, your system's security is not compromised by their use, and your personal data - other than data you submit in the account application form, and the user-agent information that is transmitted by your browser - is never transmitted to our servers.
As a general rule, we do not log on-line behavior of individuals (other than normal logging of webserver 'hits'). However, in cases of abuse, hacking, unauthorized access, Denial of Service attacks, illegal copying, hotlinking, non-compliance with international webstandards (such as robots.txt), or any other harmful behavior, our system engineers are empowered to log, track, identify, publish, and ban misbehaving individuals - even if this leads to ban entire blocks of IP addresses, or disclosing user's identity.