| *The author of this computation has been verified* | ||||||||||||||||||||||
| R Software Module: /rwasp_boxcoxlin.wasp (opens new window with default values) | ||||||||||||||||||||||
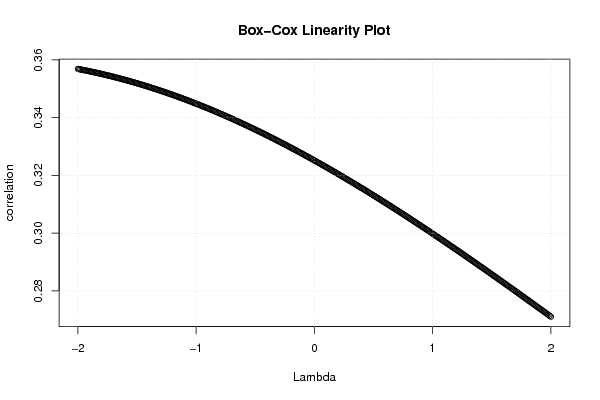
| Title produced by software: Box-Cox Linearity Plot | ||||||||||||||||||||||
| Date of computation: Wed, 29 Dec 2010 12:09:17 +0000 | ||||||||||||||||||||||
| Cite this page as follows: | ||||||||||||||||||||||
| Statistical Computations at FreeStatistics.org, Office for Research Development and Education, URL http://www.freestatistics.org/blog/date/2010/Dec/29/t129362442305hwtm6dg9os8xe.htm/, Retrieved Wed, 29 Dec 2010 13:07:04 +0100 | ||||||||||||||||||||||
| BibTeX entries for LaTeX users: | ||||||||||||||||||||||
@Manual{KEY,
    author = {{YOUR NAME}},
    publisher = {Office for Research Development and Education},
    title = {Statistical Computations at FreeStatistics.org, URL http://www.freestatistics.org/blog/date/2010/Dec/29/t129362442305hwtm6dg9os8xe.htm/},
    year = {2010},
}
@Manual{R,
    title = {R: A Language and Environment for Statistical Computing},
    author = {{R Development Core Team}},
    organization = {R Foundation for Statistical Computing},
    address = {Vienna, Austria},
    year = {2010},
    note = {{ISBN} 3-900051-07-0},
    url = {http://www.R-project.org},
}
| ||||||||||||||||||||||
| Original text written by user: | ||||||||||||||||||||||
| IsPrivate? | ||||||||||||||||||||||
| No (this computation is public) | ||||||||||||||||||||||
| User-defined keywords: | ||||||||||||||||||||||
| Dataseries X: | ||||||||||||||||||||||
| » Textbox « » Textfile « » CSV « | ||||||||||||||||||||||
| 09,166456 07,970589 07,104091 06,621064 07,529215 08,170938 08,157450 07,378962 07,921496 08,156740 08,856365 08,817177 08,734347 09,345927 08,992970 10,785120 08,886867 08,818847 08,823744 09,165298 08,652657 08,173054 07,563416 07,595809 08,381467 07,216432 06,540178 06,238914 05,487288 05,759462 05,993215 07,474726 07,348907 07,303379 07,119314 06,993780 06,958153 07,595706 08,088153 07,555753 07,315433 07,893427 08,858794 08,839367 08,014733 07,873465 08,930377 10,500550 12,611440 11,417870 11,872490 11,060820 12,043310 09,776299 09,557194 09,202590 10,224020 09,350807 08,300913 08,365779 08,133595 07,660470 08,074839 07,848597 07,998220 07,396895 07,900419 08,100500 07,899453 07,599783 08,100929 09,002175 10,298900 10,101520 10,699150 09,698140 09,800951 10,900470 10,697850 09,297252 10,397440 10,900720 12,901270 13,099060 11,698280 11,099870 11,301570 10,702110 10,099310 09,591119 | ||||||||||||||||||||||
| Dataseries Y: | ||||||||||||||||||||||
| » Textbox « » Textfile « » CSV « | ||||||||||||||||||||||
| 01,303763 01,416094 01,052458 01,312283 01,309429 01,492409 01,026556 01,005406 01,334886 01,393873 01,128092 01,122787 01,213104 01,253528 01,094796 00,912944 01,195130 00,927499 00,965333 01,198078 00,966362 00,973685 00,994801 00,826262 00,688888 00,781307 00,604791 01,086240 00,774026 01,026032 00,676435 00,830525 00,791624 00,752391 00,670202 00,880336 00,914297 00,961042 00,930194 00,867966 00,989160 00,997288 00,798744 00,975379 00,934721 00,973234 00,815300 00,940209 00,794493 00,931340 00,922050 00,784517 00,822098 00,891026 00,807306 00,951441 01,147907 01,172609 01,281051 01,165962 00,978911 01,410951 01,197838 01,288368 01,102253 01,197657 01,299984 01,198611 01,299252 01,097604 01,399770 01,398396 01,401880 01,699717 01,397610 01,500135 01,400136 01,400427 01,341477 01,338580 01,482977 01,163253 01,328468 01,234550 01,484741 01,336579 01,339292 01,405225 01,333491 01,149740 | ||||||||||||||||||||||
| Output produced by software: | ||||||||||||||||||||||
| ||||||||||||||||||||||
| Charts produced by software: | ||||||||||||||||||||||
| ||||||||||||||||||||||
| Parameters (Session): | ||||||||||||||||||||||
| Parameters (R input): | ||||||||||||||||||||||
| R code (references can be found in the software module): | ||||||||||||||||||||||
| n <- length(x)
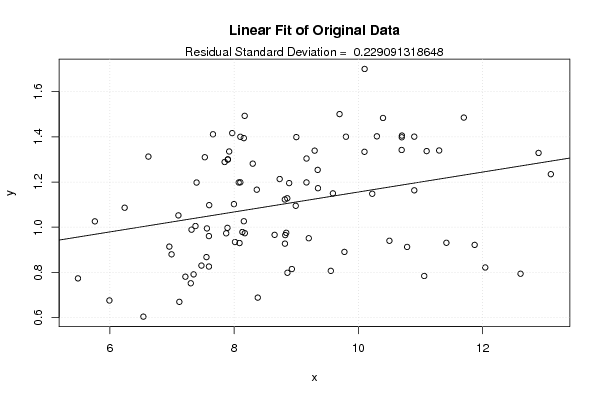
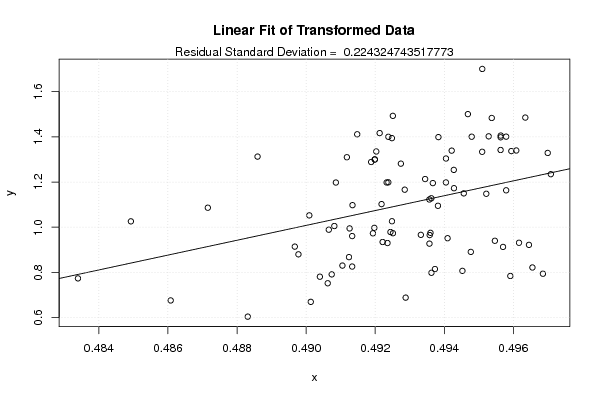
c <- array(NA,dim=c(401)) l <- array(NA,dim=c(401)) mx <- 0 mxli <- -999 for (i in 1:401) { l[i] <- (i-201)/100 if (l[i] != 0) { x1 <- (x^l[i] - 1) / l[i] } else { x1 <- log(x) } c[i] <- cor(x1,y) if (mx < abs(c[i])) { mx <- abs(c[i]) mxli <- l[i] } } c mx mxli if (mxli != 0) { x1 <- (x^mxli - 1) / mxli } else { x1 <- log(x) } r<-lm(y~x) se <- sqrt(var(r$residuals)) r1 <- lm(y~x1) se1 <- sqrt(var(r1$residuals)) bitmap(file='test1.png') plot(l,c,main='Box-Cox Linearity Plot',xlab='Lambda',ylab='correlation') grid() dev.off() bitmap(file='test2.png') plot(x,y,main='Linear Fit of Original Data',xlab='x',ylab='y') abline(r) grid() mtext(paste('Residual Standard Deviation = ',se)) dev.off() bitmap(file='test3.png') plot(x1,y,main='Linear Fit of Transformed Data',xlab='x',ylab='y') abline(r1) grid() mtext(paste('Residual Standard Deviation = ',se1)) dev.off() load(file='createtable') a<-table.start() a<-table.row.start(a) a<-table.element(a,'Box-Cox Linearity Plot',2,TRUE) a<-table.row.end(a) a<-table.row.start(a) a<-table.element(a,'# observations x',header=TRUE) a<-table.element(a,n) a<-table.row.end(a) a<-table.row.start(a) a<-table.element(a,'maximum correlation',header=TRUE) a<-table.element(a,mx) a<-table.row.end(a) a<-table.row.start(a) a<-table.element(a,'optimal lambda(x)',header=TRUE) a<-table.element(a,mxli) a<-table.row.end(a) a<-table.row.start(a) a<-table.element(a,'Residual SD (orginial)',header=TRUE) a<-table.element(a,se) a<-table.row.end(a) a<-table.row.start(a) a<-table.element(a,'Residual SD (transformed)',header=TRUE) a<-table.element(a,se1) a<-table.row.end(a) a<-table.end(a) table.save(a,file='mytable.tab') | ||||||||||||||||||||||
Copyright

This work is licensed under a
Creative Commons Attribution-Noncommercial-Share Alike 3.0 License.
Software written by Ed van Stee & Patrick Wessa
Disclaimer
Information provided on this web site is provided "AS IS" without warranty of any kind, either express or implied, including, without limitation, warranties of merchantability, fitness for a particular purpose, and noninfringement. We use reasonable efforts to include accurate and timely information and periodically update the information, and software without notice. However, we make no warranties or representations as to the accuracy or completeness of such information (or software), and we assume no liability or responsibility for errors or omissions in the content of this web site, or any software bugs in online applications. Your use of this web site is AT YOUR OWN RISK. Under no circumstances and under no legal theory shall we be liable to you or any other person for any direct, indirect, special, incidental, exemplary, or consequential damages arising from your access to, or use of, this web site.
Privacy Policy
We may request personal information to be submitted to our servers in order to be able to:
- personalize online software applications according to your needs
- enforce strict security rules with respect to the data that you upload (e.g. statistical data)
- manage user sessions of online applications
- alert you about important changes or upgrades in resources or applications
We NEVER allow other companies to directly offer registered users information about their products and services. Banner references and hyperlinks of third parties NEVER contain any personal data of the visitor.
We do NOT sell, nor transmit by any means, personal information, nor statistical data series uploaded by you to third parties.
We carefully protect your data from loss, misuse, alteration,
and destruction. However, at any time, and under any circumstance you
are solely responsible for managing your passwords, and keeping them
secret.
We store a unique ANONYMOUS USER ID in the form of a small 'Cookie' on your computer. This allows us to track your progress when using this website which is necessary to create state-dependent features. The cookie is used for NO OTHER PURPOSE. At any time you may opt to disallow cookies from this website - this will not affect other features of this website.
We examine cookies that are used by third-parties (banner and online ads) very closely: abuse from third-parties automatically results in termination of the advertising contract without refund. We have very good reason to believe that the cookies that are produced by third parties (banner ads) do NOT cause any privacy or security risk.
FreeStatistics.org is safe. There is no need to download any software to use the applications and services contained in this website. Hence, your system's security is not compromised by their use, and your personal data - other than data you submit in the account application form, and the user-agent information that is transmitted by your browser - is never transmitted to our servers.
As a general rule, we do not log on-line behavior of individuals (other than normal logging of webserver 'hits'). However, in cases of abuse, hacking, unauthorized access, Denial of Service attacks, illegal copying, hotlinking, non-compliance with international webstandards (such as robots.txt), or any other harmful behavior, our system engineers are empowered to log, track, identify, publish, and ban misbehaving individuals - even if this leads to ban entire blocks of IP addresses, or disclosing user's identity.