Forcasting Roebel | ||||||||||||||||||||||||||||||||||||||||||||||||||||||||||||||||||||||||||||||||||||||||||||||||||||||||||||||||||||||||||||||||||||||||||||||||||||||||||||||||||||||||||||||||||||||||||||||||||||||||||||||||||||||||||||||||||||||||||||||||||||||||||||||||||||||||||||||||||||||||||||||||||||||||||||||||||||||||||||||||||||||||||||||||
| *The author of this computation has been verified* | ||||||||||||||||||||||||||||||||||||||||||||||||||||||||||||||||||||||||||||||||||||||||||||||||||||||||||||||||||||||||||||||||||||||||||||||||||||||||||||||||||||||||||||||||||||||||||||||||||||||||||||||||||||||||||||||||||||||||||||||||||||||||||||||||||||||||||||||||||||||||||||||||||||||||||||||||||||||||||||||||||||||||||||||||
| R Software Module: /rwasp_arimaforecasting.wasp (opens new window with default values) | ||||||||||||||||||||||||||||||||||||||||||||||||||||||||||||||||||||||||||||||||||||||||||||||||||||||||||||||||||||||||||||||||||||||||||||||||||||||||||||||||||||||||||||||||||||||||||||||||||||||||||||||||||||||||||||||||||||||||||||||||||||||||||||||||||||||||||||||||||||||||||||||||||||||||||||||||||||||||||||||||||||||||||||||||
| Title produced by software: ARIMA Forecasting | ||||||||||||||||||||||||||||||||||||||||||||||||||||||||||||||||||||||||||||||||||||||||||||||||||||||||||||||||||||||||||||||||||||||||||||||||||||||||||||||||||||||||||||||||||||||||||||||||||||||||||||||||||||||||||||||||||||||||||||||||||||||||||||||||||||||||||||||||||||||||||||||||||||||||||||||||||||||||||||||||||||||||||||||||
| Date of computation: Sat, 25 Dec 2010 16:40:42 +0000 | ||||||||||||||||||||||||||||||||||||||||||||||||||||||||||||||||||||||||||||||||||||||||||||||||||||||||||||||||||||||||||||||||||||||||||||||||||||||||||||||||||||||||||||||||||||||||||||||||||||||||||||||||||||||||||||||||||||||||||||||||||||||||||||||||||||||||||||||||||||||||||||||||||||||||||||||||||||||||||||||||||||||||||||||||
| Cite this page as follows: | ||||||||||||||||||||||||||||||||||||||||||||||||||||||||||||||||||||||||||||||||||||||||||||||||||||||||||||||||||||||||||||||||||||||||||||||||||||||||||||||||||||||||||||||||||||||||||||||||||||||||||||||||||||||||||||||||||||||||||||||||||||||||||||||||||||||||||||||||||||||||||||||||||||||||||||||||||||||||||||||||||||||||||||||||
| Statistical Computations at FreeStatistics.org, Office for Research Development and Education, URL http://www.freestatistics.org/blog/date/2010/Dec/25/t1293295223snv4r8zea876wpm.htm/, Retrieved Sat, 25 Dec 2010 17:40:25 +0100 | ||||||||||||||||||||||||||||||||||||||||||||||||||||||||||||||||||||||||||||||||||||||||||||||||||||||||||||||||||||||||||||||||||||||||||||||||||||||||||||||||||||||||||||||||||||||||||||||||||||||||||||||||||||||||||||||||||||||||||||||||||||||||||||||||||||||||||||||||||||||||||||||||||||||||||||||||||||||||||||||||||||||||||||||||
| BibTeX entries for LaTeX users: | ||||||||||||||||||||||||||||||||||||||||||||||||||||||||||||||||||||||||||||||||||||||||||||||||||||||||||||||||||||||||||||||||||||||||||||||||||||||||||||||||||||||||||||||||||||||||||||||||||||||||||||||||||||||||||||||||||||||||||||||||||||||||||||||||||||||||||||||||||||||||||||||||||||||||||||||||||||||||||||||||||||||||||||||||
@Manual{KEY,
    author = {{YOUR NAME}},
    publisher = {Office for Research Development and Education},
    title = {Statistical Computations at FreeStatistics.org, URL http://www.freestatistics.org/blog/date/2010/Dec/25/t1293295223snv4r8zea876wpm.htm/},
    year = {2010},
}
@Manual{R,
    title = {R: A Language and Environment for Statistical Computing},
    author = {{R Development Core Team}},
    organization = {R Foundation for Statistical Computing},
    address = {Vienna, Austria},
    year = {2010},
    note = {{ISBN} 3-900051-07-0},
    url = {http://www.R-project.org},
}
| ||||||||||||||||||||||||||||||||||||||||||||||||||||||||||||||||||||||||||||||||||||||||||||||||||||||||||||||||||||||||||||||||||||||||||||||||||||||||||||||||||||||||||||||||||||||||||||||||||||||||||||||||||||||||||||||||||||||||||||||||||||||||||||||||||||||||||||||||||||||||||||||||||||||||||||||||||||||||||||||||||||||||||||||||
| Original text written by user: | ||||||||||||||||||||||||||||||||||||||||||||||||||||||||||||||||||||||||||||||||||||||||||||||||||||||||||||||||||||||||||||||||||||||||||||||||||||||||||||||||||||||||||||||||||||||||||||||||||||||||||||||||||||||||||||||||||||||||||||||||||||||||||||||||||||||||||||||||||||||||||||||||||||||||||||||||||||||||||||||||||||||||||||||||
| IsPrivate? | ||||||||||||||||||||||||||||||||||||||||||||||||||||||||||||||||||||||||||||||||||||||||||||||||||||||||||||||||||||||||||||||||||||||||||||||||||||||||||||||||||||||||||||||||||||||||||||||||||||||||||||||||||||||||||||||||||||||||||||||||||||||||||||||||||||||||||||||||||||||||||||||||||||||||||||||||||||||||||||||||||||||||||||||||
| No (this computation is public) | ||||||||||||||||||||||||||||||||||||||||||||||||||||||||||||||||||||||||||||||||||||||||||||||||||||||||||||||||||||||||||||||||||||||||||||||||||||||||||||||||||||||||||||||||||||||||||||||||||||||||||||||||||||||||||||||||||||||||||||||||||||||||||||||||||||||||||||||||||||||||||||||||||||||||||||||||||||||||||||||||||||||||||||||||
| User-defined keywords: | ||||||||||||||||||||||||||||||||||||||||||||||||||||||||||||||||||||||||||||||||||||||||||||||||||||||||||||||||||||||||||||||||||||||||||||||||||||||||||||||||||||||||||||||||||||||||||||||||||||||||||||||||||||||||||||||||||||||||||||||||||||||||||||||||||||||||||||||||||||||||||||||||||||||||||||||||||||||||||||||||||||||||||||||||
| Dataseries X: | ||||||||||||||||||||||||||||||||||||||||||||||||||||||||||||||||||||||||||||||||||||||||||||||||||||||||||||||||||||||||||||||||||||||||||||||||||||||||||||||||||||||||||||||||||||||||||||||||||||||||||||||||||||||||||||||||||||||||||||||||||||||||||||||||||||||||||||||||||||||||||||||||||||||||||||||||||||||||||||||||||||||||||||||||
| » Textbox « » Textfile « » CSV « | ||||||||||||||||||||||||||||||||||||||||||||||||||||||||||||||||||||||||||||||||||||||||||||||||||||||||||||||||||||||||||||||||||||||||||||||||||||||||||||||||||||||||||||||||||||||||||||||||||||||||||||||||||||||||||||||||||||||||||||||||||||||||||||||||||||||||||||||||||||||||||||||||||||||||||||||||||||||||||||||||||||||||||||||||
| 40,7819 39,5915 38,8859 39,9068 41,47 41,5613 41,6005 41,4113 41,84 42,2892 43,1521 43,5998 43,116 42,4185 42,3687 42,2975 42,8528 43,535 44,7265 45,7293 45,7585 46,1685 46,5075 46,527 46,601 46,4607 46,7135 46,4113 45,55 44,6081 44,4395 44,9847 45,7558 45,3942 45,697 45,5664 46,0205 45,9195 45,8005 45,535 45,4977 45,5782 45,7697 45,2445 45,0615 45,2865 44,791 44,7625 44,7644 44,9973 44,7265 45,1465 44,7465 45,1795 45,6515 45,492 45,2775 45,2115 45,411 45,4005 44,7692 44,8913 45,032 44,879 44,833 44,8257 44,7815 44,479 44,6317 44,5043 44,3217 44,1005 44,047 43,6835 43,7864 44,1807 43,9595 43,937 43,991 43,865 43,671 43,93 43,863 43,7095 43,9435 43,736 43,6295 43,598 43,8726 43,8935 43,5957 43,7155 43,528 43,3415 43,3374 43,332 43,3869 43,5016 43,4875 43,6023 43,3886 43,3105 43,4455 43,5185 43,5755 43,6217 43,644 43,5789 43,5215 43,5033 43,632 43,263 43,3717 43,2745 43,2647 43,324 43,4455 43,409 etc... | ||||||||||||||||||||||||||||||||||||||||||||||||||||||||||||||||||||||||||||||||||||||||||||||||||||||||||||||||||||||||||||||||||||||||||||||||||||||||||||||||||||||||||||||||||||||||||||||||||||||||||||||||||||||||||||||||||||||||||||||||||||||||||||||||||||||||||||||||||||||||||||||||||||||||||||||||||||||||||||||||||||||||||||||||
| Output produced by software: | ||||||||||||||||||||||||||||||||||||||||||||||||||||||||||||||||||||||||||||||||||||||||||||||||||||||||||||||||||||||||||||||||||||||||||||||||||||||||||||||||||||||||||||||||||||||||||||||||||||||||||||||||||||||||||||||||||||||||||||||||||||||||||||||||||||||||||||||||||||||||||||||||||||||||||||||||||||||||||||||||||||||||||||||||
| ||||||||||||||||||||||||||||||||||||||||||||||||||||||||||||||||||||||||||||||||||||||||||||||||||||||||||||||||||||||||||||||||||||||||||||||||||||||||||||||||||||||||||||||||||||||||||||||||||||||||||||||||||||||||||||||||||||||||||||||||||||||||||||||||||||||||||||||||||||||||||||||||||||||||||||||||||||||||||||||||||||||||||||||||
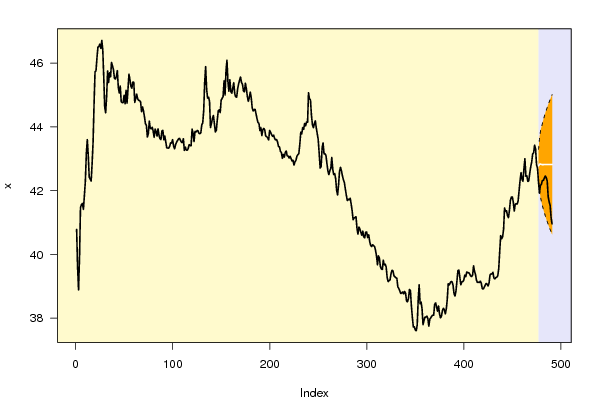
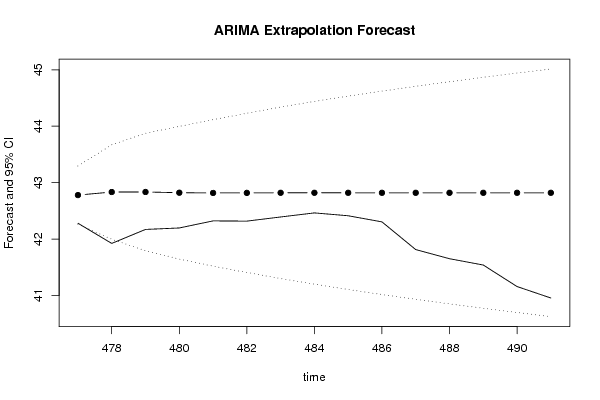
| Charts produced by software: | ||||||||||||||||||||||||||||||||||||||||||||||||||||||||||||||||||||||||||||||||||||||||||||||||||||||||||||||||||||||||||||||||||||||||||||||||||||||||||||||||||||||||||||||||||||||||||||||||||||||||||||||||||||||||||||||||||||||||||||||||||||||||||||||||||||||||||||||||||||||||||||||||||||||||||||||||||||||||||||||||||||||||||||||||
| ||||||||||||||||||||||||||||||||||||||||||||||||||||||||||||||||||||||||||||||||||||||||||||||||||||||||||||||||||||||||||||||||||||||||||||||||||||||||||||||||||||||||||||||||||||||||||||||||||||||||||||||||||||||||||||||||||||||||||||||||||||||||||||||||||||||||||||||||||||||||||||||||||||||||||||||||||||||||||||||||||||||||||||||||
| Parameters (Session): | ||||||||||||||||||||||||||||||||||||||||||||||||||||||||||||||||||||||||||||||||||||||||||||||||||||||||||||||||||||||||||||||||||||||||||||||||||||||||||||||||||||||||||||||||||||||||||||||||||||||||||||||||||||||||||||||||||||||||||||||||||||||||||||||||||||||||||||||||||||||||||||||||||||||||||||||||||||||||||||||||||||||||||||||||
| par1 = 15 ; par2 = 1 ; par3 = 1 ; par4 = 0 ; par5 = 1 ; par6 = 3 ; par7 = 1 ; par8 = 0 ; par9 = 0 ; par10 = FALSE ; | ||||||||||||||||||||||||||||||||||||||||||||||||||||||||||||||||||||||||||||||||||||||||||||||||||||||||||||||||||||||||||||||||||||||||||||||||||||||||||||||||||||||||||||||||||||||||||||||||||||||||||||||||||||||||||||||||||||||||||||||||||||||||||||||||||||||||||||||||||||||||||||||||||||||||||||||||||||||||||||||||||||||||||||||||
| Parameters (R input): | ||||||||||||||||||||||||||||||||||||||||||||||||||||||||||||||||||||||||||||||||||||||||||||||||||||||||||||||||||||||||||||||||||||||||||||||||||||||||||||||||||||||||||||||||||||||||||||||||||||||||||||||||||||||||||||||||||||||||||||||||||||||||||||||||||||||||||||||||||||||||||||||||||||||||||||||||||||||||||||||||||||||||||||||||
| par1 = 15 ; par2 = 1 ; par3 = 1 ; par4 = 0 ; par5 = 1 ; par6 = 3 ; par7 = 1 ; par8 = 0 ; par9 = 0 ; par10 = FALSE ; | ||||||||||||||||||||||||||||||||||||||||||||||||||||||||||||||||||||||||||||||||||||||||||||||||||||||||||||||||||||||||||||||||||||||||||||||||||||||||||||||||||||||||||||||||||||||||||||||||||||||||||||||||||||||||||||||||||||||||||||||||||||||||||||||||||||||||||||||||||||||||||||||||||||||||||||||||||||||||||||||||||||||||||||||||
| R code (references can be found in the software module): | ||||||||||||||||||||||||||||||||||||||||||||||||||||||||||||||||||||||||||||||||||||||||||||||||||||||||||||||||||||||||||||||||||||||||||||||||||||||||||||||||||||||||||||||||||||||||||||||||||||||||||||||||||||||||||||||||||||||||||||||||||||||||||||||||||||||||||||||||||||||||||||||||||||||||||||||||||||||||||||||||||||||||||||||||
| par1 <- as.numeric(par1) #cut off periods
par2 <- as.numeric(par2) #lambda par3 <- as.numeric(par3) #degree of non-seasonal differencing par4 <- as.numeric(par4) #degree of seasonal differencing par5 <- 5 #seasonal period par6 <- as.numeric(par6) #p par7 <- as.numeric(par7) #q par8 <- as.numeric(par8) #P par9 <- as.numeric(par9) #Q if (par10 == 'TRUE') par10 <- TRUE if (par10 == 'FALSE') par10 <- FALSE if (par2 == 0) x <- log(x) if (par2 != 0) x <- x^par2 lx <- length(x) first <- lx - 2*par1 nx <- lx - par1 nx1 <- nx + 1 fx <- lx - nx if (fx < 1) { fx <- par5 nx1 <- lx + fx - 1 first <- lx - 2*fx } first <- 1 if (fx < 3) fx <- round(lx/10,0) (arima.out <- arima(x[1:nx], order=c(par6,par3,par7), seasonal=list(order=c(par8,par4,par9), period=par5), include.mean=par10, method='ML')) (forecast <- predict(arima.out,par1)) (lb <- forecast$pred - 1.96 * forecast$se) (ub <- forecast$pred + 1.96 * forecast$se) if (par2 == 0) { x <- exp(x) forecast$pred <- exp(forecast$pred) lb <- exp(lb) ub <- exp(ub) } if (par2 != 0) { x <- x^(1/par2) forecast$pred <- forecast$pred^(1/par2) lb <- lb^(1/par2) ub <- ub^(1/par2) } if (par2 < 0) { olb <- lb lb <- ub ub <- olb } (actandfor <- c(x[1:nx], forecast$pred)) (perc.se <- (ub-forecast$pred)/1.96/forecast$pred) bitmap(file='test1.png') opar <- par(mar=c(4,4,2,2),las=1) ylim <- c( min(x[first:nx],lb), max(x[first:nx],ub)) plot(x,ylim=ylim,type='n',xlim=c(first,lx)) usr <- par('usr') rect(usr[1],usr[3],nx+1,usr[4],border=NA,col='lemonchiffon') rect(nx1,usr[3],usr[2],usr[4],border=NA,col='lavender') abline(h= (-3:3)*2 , col ='gray', lty =3) polygon( c(nx1:lx,lx:nx1), c(lb,rev(ub)), col = 'orange', lty=2,border=NA) lines(nx1:lx, lb , lty=2) lines(nx1:lx, ub , lty=2) lines(x, lwd=2) lines(nx1:lx, forecast$pred , lwd=2 , col ='white') box() par(opar) dev.off() prob.dec <- array(NA, dim=fx) prob.sdec <- array(NA, dim=fx) prob.ldec <- array(NA, dim=fx) prob.pval <- array(NA, dim=fx) perf.pe <- array(0, dim=fx) perf.mape <- array(0, dim=fx) perf.mape1 <- array(0, dim=fx) perf.se <- array(0, dim=fx) perf.mse <- array(0, dim=fx) perf.mse1 <- array(0, dim=fx) perf.rmse <- array(0, dim=fx) for (i in 1:fx) { locSD <- (ub[i] - forecast$pred[i]) / 1.96 perf.pe[i] = (x[nx+i] - forecast$pred[i]) / forecast$pred[i] perf.se[i] = (x[nx+i] - forecast$pred[i])^2 prob.dec[i] = pnorm((x[nx+i-1] - forecast$pred[i]) / locSD) prob.sdec[i] = pnorm((x[nx+i-par5] - forecast$pred[i]) / locSD) prob.ldec[i] = pnorm((x[nx] - forecast$pred[i]) / locSD) prob.pval[i] = pnorm(abs(x[nx+i] - forecast$pred[i]) / locSD) } perf.mape[1] = abs(perf.pe[1]) perf.mse[1] = abs(perf.se[1]) for (i in 2:fx) { perf.mape[i] = perf.mape[i-1] + abs(perf.pe[i]) perf.mape1[i] = perf.mape[i] / i perf.mse[i] = perf.mse[i-1] + perf.se[i] perf.mse1[i] = perf.mse[i] / i } perf.rmse = sqrt(perf.mse1) bitmap(file='test2.png') plot(forecast$pred, pch=19, type='b',main='ARIMA Extrapolation Forecast', ylab='Forecast and 95% CI', xlab='time',ylim=c(min(lb),max(ub))) dum <- forecast$pred dum[1:par1] <- x[(nx+1):lx] lines(dum, lty=1) lines(ub,lty=3) lines(lb,lty=3) dev.off() load(file='createtable') a<-table.start() a<-table.row.start(a) a<-table.element(a,'Univariate ARIMA Extrapolation Forecast',9,TRUE) a<-table.row.end(a) a<-table.row.start(a) a<-table.element(a,'time',1,header=TRUE) a<-table.element(a,'Y[t]',1,header=TRUE) a<-table.element(a,'F[t]',1,header=TRUE) a<-table.element(a,'95% LB',1,header=TRUE) a<-table.element(a,'95% UB',1,header=TRUE) a<-table.element(a,'p-value<br />(H0: Y[t] = F[t])',1,header=TRUE) a<-table.element(a,'P(F[t]>Y[t-1])',1,header=TRUE) a<-table.element(a,'P(F[t]>Y[t-s])',1,header=TRUE) mylab <- paste('P(F[t]>Y[',nx,sep='') mylab <- paste(mylab,'])',sep='') a<-table.element(a,mylab,1,header=TRUE) a<-table.row.end(a) for (i in (nx-par5):nx) { a<-table.row.start(a) a<-table.element(a,i,header=TRUE) a<-table.element(a,x[i]) a<-table.element(a,'-') a<-table.element(a,'-') a<-table.element(a,'-') a<-table.element(a,'-') a<-table.element(a,'-') a<-table.element(a,'-') a<-table.element(a,'-') a<-table.row.end(a) } for (i in 1:fx) { a<-table.row.start(a) a<-table.element(a,nx+i,header=TRUE) a<-table.element(a,round(x[nx+i],4)) a<-table.element(a,round(forecast$pred[i],4)) a<-table.element(a,round(lb[i],4)) a<-table.element(a,round(ub[i],4)) a<-table.element(a,round((1-prob.pval[i]),4)) a<-table.element(a,round((1-prob.dec[i]),4)) a<-table.element(a,round((1-prob.sdec[i]),4)) a<-table.element(a,round((1-prob.ldec[i]),4)) a<-table.row.end(a) } a<-table.end(a) table.save(a,file='mytable.tab') a<-table.start() a<-table.row.start(a) a<-table.element(a,'Univariate ARIMA Extrapolation Forecast Performance',7,TRUE) a<-table.row.end(a) a<-table.row.start(a) a<-table.element(a,'time',1,header=TRUE) a<-table.element(a,'% S.E.',1,header=TRUE) a<-table.element(a,'PE',1,header=TRUE) a<-table.element(a,'MAPE',1,header=TRUE) a<-table.element(a,'Sq.E',1,header=TRUE) a<-table.element(a,'MSE',1,header=TRUE) a<-table.element(a,'RMSE',1,header=TRUE) a<-table.row.end(a) for (i in 1:fx) { a<-table.row.start(a) a<-table.element(a,nx+i,header=TRUE) a<-table.element(a,round(perc.se[i],4)) a<-table.element(a,round(perf.pe[i],4)) a<-table.element(a,round(perf.mape1[i],4)) a<-table.element(a,round(perf.se[i],4)) a<-table.element(a,round(perf.mse1[i],4)) a<-table.element(a,round(perf.rmse[i],4)) a<-table.row.end(a) } a<-table.end(a) table.save(a,file='mytable1.tab') | ||||||||||||||||||||||||||||||||||||||||||||||||||||||||||||||||||||||||||||||||||||||||||||||||||||||||||||||||||||||||||||||||||||||||||||||||||||||||||||||||||||||||||||||||||||||||||||||||||||||||||||||||||||||||||||||||||||||||||||||||||||||||||||||||||||||||||||||||||||||||||||||||||||||||||||||||||||||||||||||||||||||||||||||||
Copyright

This work is licensed under a
Creative Commons Attribution-Noncommercial-Share Alike 3.0 License.
Software written by Ed van Stee & Patrick Wessa
Disclaimer
Information provided on this web site is provided "AS IS" without warranty of any kind, either express or implied, including, without limitation, warranties of merchantability, fitness for a particular purpose, and noninfringement. We use reasonable efforts to include accurate and timely information and periodically update the information, and software without notice. However, we make no warranties or representations as to the accuracy or completeness of such information (or software), and we assume no liability or responsibility for errors or omissions in the content of this web site, or any software bugs in online applications. Your use of this web site is AT YOUR OWN RISK. Under no circumstances and under no legal theory shall we be liable to you or any other person for any direct, indirect, special, incidental, exemplary, or consequential damages arising from your access to, or use of, this web site.
Privacy Policy
We may request personal information to be submitted to our servers in order to be able to:
- personalize online software applications according to your needs
- enforce strict security rules with respect to the data that you upload (e.g. statistical data)
- manage user sessions of online applications
- alert you about important changes or upgrades in resources or applications
We NEVER allow other companies to directly offer registered users information about their products and services. Banner references and hyperlinks of third parties NEVER contain any personal data of the visitor.
We do NOT sell, nor transmit by any means, personal information, nor statistical data series uploaded by you to third parties.
We carefully protect your data from loss, misuse, alteration,
and destruction. However, at any time, and under any circumstance you
are solely responsible for managing your passwords, and keeping them
secret.
We store a unique ANONYMOUS USER ID in the form of a small 'Cookie' on your computer. This allows us to track your progress when using this website which is necessary to create state-dependent features. The cookie is used for NO OTHER PURPOSE. At any time you may opt to disallow cookies from this website - this will not affect other features of this website.
We examine cookies that are used by third-parties (banner and online ads) very closely: abuse from third-parties automatically results in termination of the advertising contract without refund. We have very good reason to believe that the cookies that are produced by third parties (banner ads) do NOT cause any privacy or security risk.
FreeStatistics.org is safe. There is no need to download any software to use the applications and services contained in this website. Hence, your system's security is not compromised by their use, and your personal data - other than data you submit in the account application form, and the user-agent information that is transmitted by your browser - is never transmitted to our servers.
As a general rule, we do not log on-line behavior of individuals (other than normal logging of webserver 'hits'). However, in cases of abuse, hacking, unauthorized access, Denial of Service attacks, illegal copying, hotlinking, non-compliance with international webstandards (such as robots.txt), or any other harmful behavior, our system engineers are empowered to log, track, identify, publish, and ban misbehaving individuals - even if this leads to ban entire blocks of IP addresses, or disclosing user's identity.