kendal | ||||||||||||||||||||||||||||||||||||||||||||||||||||||||||||||
| *The author of this computation has been verified* | ||||||||||||||||||||||||||||||||||||||||||||||||||||||||||||||
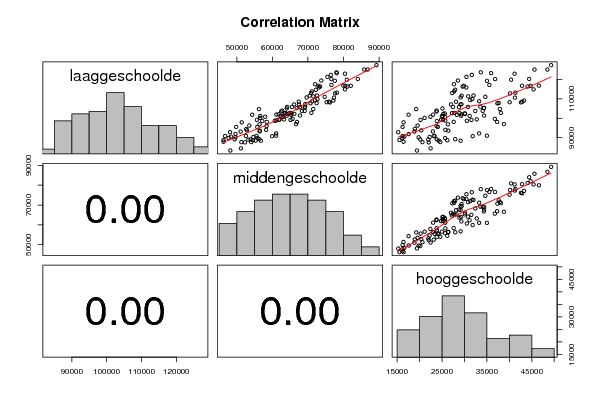
| R Software Module: Patrick.Wessa/rwasp_pairs.wasp (opens new window with default values) | ||||||||||||||||||||||||||||||||||||||||||||||||||||||||||||||
| Title produced by software: Kendall tau Correlation Matrix | ||||||||||||||||||||||||||||||||||||||||||||||||||||||||||||||
| Date of computation: Fri, 24 Dec 2010 10:44:18 +0000 | ||||||||||||||||||||||||||||||||||||||||||||||||||||||||||||||
| Cite this page as follows: | ||||||||||||||||||||||||||||||||||||||||||||||||||||||||||||||
| Statistical Computations at FreeStatistics.org, Office for Research Development and Education, URL http://www.freestatistics.org/blog/date/2010/Dec/24/t129318737057waagy6nnsq6s4.htm/, Retrieved Fri, 24 Dec 2010 11:42:51 +0100 | ||||||||||||||||||||||||||||||||||||||||||||||||||||||||||||||
| BibTeX entries for LaTeX users: | ||||||||||||||||||||||||||||||||||||||||||||||||||||||||||||||
@Manual{KEY,
    author = {{YOUR NAME}},
    publisher = {Office for Research Development and Education},
    title = {Statistical Computations at FreeStatistics.org, URL http://www.freestatistics.org/blog/date/2010/Dec/24/t129318737057waagy6nnsq6s4.htm/},
    year = {2010},
}
@Manual{R,
    title = {R: A Language and Environment for Statistical Computing},
    author = {{R Development Core Team}},
    organization = {R Foundation for Statistical Computing},
    address = {Vienna, Austria},
    year = {2010},
    note = {{ISBN} 3-900051-07-0},
    url = {http://www.R-project.org},
}
| ||||||||||||||||||||||||||||||||||||||||||||||||||||||||||||||
| Original text written by user: | ||||||||||||||||||||||||||||||||||||||||||||||||||||||||||||||
| IsPrivate? | ||||||||||||||||||||||||||||||||||||||||||||||||||||||||||||||
| No (this computation is public) | ||||||||||||||||||||||||||||||||||||||||||||||||||||||||||||||
| User-defined keywords: | ||||||||||||||||||||||||||||||||||||||||||||||||||||||||||||||
| Dataseries X: | ||||||||||||||||||||||||||||||||||||||||||||||||||||||||||||||
| » Textbox « » Textfile « » CSV « | ||||||||||||||||||||||||||||||||||||||||||||||||||||||||||||||
| 104708 56190 19246 101817 54300 17549 97898 51362 16428 95559 49802 16209 92822 48088 15235 90848 46696 16186 101141 56586 24971 105841 64148 30776 93647 56449 26416 90923 52538 23157 89130 49359 20155 90212 49583 19790 93196 51050 18849 91861 49610 17573 90593 48321 16597 89895 47692 16158 88819 46243 15507 87924 46248 16433 96906 56381 26325 101217 62329 31144 98709 60673 30535 98139 58393 27596 95529 55742 24064 98577 57135 23854 100772 57961 22407 100180 56571 21125 99200 55615 20226 96251 53494 19547 94514 52623 18933 93780 52820 20372 105192 66825 34331 107682 70695 37329 99687 65660 36761 99436 63238 32737 102049 61741 29321 102673 63642 28883 105813 65521 27436 105056 64006 25101 103916 62728 23776 103513 62438 23782 101893 61109 23027 102503 63422 25606 113149 78094 41328 116696 82030 44751 108500 75892 42855 107800 72431 37628 105941 69194 33544 108742 71171 33275 111680 72545 32009 111270 71503 30813 110698 69624 29143 108517 67407 28121 107127 66 etc... | ||||||||||||||||||||||||||||||||||||||||||||||||||||||||||||||
| Output produced by software: | ||||||||||||||||||||||||||||||||||||||||||||||||||||||||||||||
Enter (or paste) a matrix (table) containing all data (time) series. Every column represents a different variable and must be delimited by a space or Tab. Every row represents a period in time (or category) and must be delimited by hard returns. The easiest way to enter data is to copy and paste a block of spreadsheet cells. Please, do not use commas or spaces to seperate groups of digits!
| ||||||||||||||||||||||||||||||||||||||||||||||||||||||||||||||
| Charts produced by software: | ||||||||||||||||||||||||||||||||||||||||||||||||||||||||||||||
| ||||||||||||||||||||||||||||||||||||||||||||||||||||||||||||||
| Parameters (Session): | ||||||||||||||||||||||||||||||||||||||||||||||||||||||||||||||
| par1 = kendall ; | ||||||||||||||||||||||||||||||||||||||||||||||||||||||||||||||
| Parameters (R input): | ||||||||||||||||||||||||||||||||||||||||||||||||||||||||||||||
| par1 = kendall ; | ||||||||||||||||||||||||||||||||||||||||||||||||||||||||||||||
| R code (references can be found in the software module): | ||||||||||||||||||||||||||||||||||||||||||||||||||||||||||||||
| par1 <- 'pearson'
panel.tau <- function(x, y, digits=2, prefix='', cex.cor) { usr <- par('usr'); on.exit(par(usr)) par(usr = c(0, 1, 0, 1)) rr <- cor.test(x, y, method=par1) r <- round(rr$p.value,2) txt <- format(c(r, 0.123456789), digits=digits)[1] txt <- paste(prefix, txt, sep='') if(missing(cex.cor)) cex <- 0.5/strwidth(txt) text(0.5, 0.5, txt, cex = cex) } panel.hist <- function(x, ...) { usr <- par('usr'); on.exit(par(usr)) par(usr = c(usr[1:2], 0, 1.5) ) h <- hist(x, plot = FALSE) breaks <- h$breaks; nB <- length(breaks) y <- h$counts; y <- y/max(y) rect(breaks[-nB], 0, breaks[-1], y, col='grey', ...) } bitmap(file='test1.png') pairs(t(y),diag.panel=panel.hist, upper.panel=panel.smooth, lower.panel=panel.tau, main=main) dev.off() load(file='createtable') n <- length(y[,1]) n a<-table.start() a<-table.row.start(a) a<-table.element(a,paste('Correlations for all pairs of data series (method=',par1,')',sep=''),n+1,TRUE) a<-table.row.end(a) a<-table.row.start(a) a<-table.element(a,' ',header=TRUE) for (i in 1:n) { a<-table.element(a,dimnames(t(x))[[2]][i],header=TRUE) } a<-table.row.end(a) for (i in 1:n) { a<-table.row.start(a) a<-table.element(a,dimnames(t(x))[[2]][i],header=TRUE) for (j in 1:n) { r <- cor.test(y[i,],y[j,],method=par1) a<-table.element(a,round(r$estimate,3)) } a<-table.row.end(a) } a<-table.end(a) table.save(a,file='mytable.tab') a<-table.start() a<-table.row.start(a) a<-table.element(a,'Correlations for all pairs of data series with p-values',4,TRUE) a<-table.row.end(a) a<-table.row.start(a) a<-table.element(a,'pair',1,TRUE) a<-table.element(a,'Pearson r',1,TRUE) a<-table.element(a,'Spearman rho',1,TRUE) a<-table.element(a,'Kendall tau',1,TRUE) a<-table.row.end(a) cor.test(y[1,],y[2,],method=par1) for (i in 1:(n-1)) { for (j in (i+1):n) { a<-table.row.start(a) dum <- paste(dimnames(t(x))[[2]][i],';',dimnames(t(x))[[2]][j],sep='') a<-table.element(a,dum,header=TRUE) rp <- cor.test(y[i,],y[j,],method='pearson') a<-table.element(a,round(rp$estimate,4)) rs <- cor.test(y[i,],y[j,],method='spearman') a<-table.element(a,round(rs$estimate,4)) rk <- cor.test(y[i,],y[j,],method='kendall') a<-table.element(a,round(rk$estimate,4)) a<-table.row.end(a) a<-table.row.start(a) a<-table.element(a,'p-value',header=T) a<-table.element(a,paste('(',round(rp$p.value,4),')',sep='')) a<-table.element(a,paste('(',round(rs$p.value,4),')',sep='')) a<-table.element(a,paste('(',round(rk$p.value,4),')',sep='')) a<-table.row.end(a) } } a<-table.end(a) table.save(a,file='mytable1.tab') | ||||||||||||||||||||||||||||||||||||||||||||||||||||||||||||||
Copyright

This work is licensed under a
Creative Commons Attribution-Noncommercial-Share Alike 3.0 License.
Software written by Ed van Stee & Patrick Wessa
Disclaimer
Information provided on this web site is provided "AS IS" without warranty of any kind, either express or implied, including, without limitation, warranties of merchantability, fitness for a particular purpose, and noninfringement. We use reasonable efforts to include accurate and timely information and periodically update the information, and software without notice. However, we make no warranties or representations as to the accuracy or completeness of such information (or software), and we assume no liability or responsibility for errors or omissions in the content of this web site, or any software bugs in online applications. Your use of this web site is AT YOUR OWN RISK. Under no circumstances and under no legal theory shall we be liable to you or any other person for any direct, indirect, special, incidental, exemplary, or consequential damages arising from your access to, or use of, this web site.
Privacy Policy
We may request personal information to be submitted to our servers in order to be able to:
- personalize online software applications according to your needs
- enforce strict security rules with respect to the data that you upload (e.g. statistical data)
- manage user sessions of online applications
- alert you about important changes or upgrades in resources or applications
We NEVER allow other companies to directly offer registered users information about their products and services. Banner references and hyperlinks of third parties NEVER contain any personal data of the visitor.
We do NOT sell, nor transmit by any means, personal information, nor statistical data series uploaded by you to third parties.
We carefully protect your data from loss, misuse, alteration,
and destruction. However, at any time, and under any circumstance you
are solely responsible for managing your passwords, and keeping them
secret.
We store a unique ANONYMOUS USER ID in the form of a small 'Cookie' on your computer. This allows us to track your progress when using this website which is necessary to create state-dependent features. The cookie is used for NO OTHER PURPOSE. At any time you may opt to disallow cookies from this website - this will not affect other features of this website.
We examine cookies that are used by third-parties (banner and online ads) very closely: abuse from third-parties automatically results in termination of the advertising contract without refund. We have very good reason to believe that the cookies that are produced by third parties (banner ads) do NOT cause any privacy or security risk.
FreeStatistics.org is safe. There is no need to download any software to use the applications and services contained in this website. Hence, your system's security is not compromised by their use, and your personal data - other than data you submit in the account application form, and the user-agent information that is transmitted by your browser - is never transmitted to our servers.
As a general rule, we do not log on-line behavior of individuals (other than normal logging of webserver 'hits'). However, in cases of abuse, hacking, unauthorized access, Denial of Service attacks, illegal copying, hotlinking, non-compliance with international webstandards (such as robots.txt), or any other harmful behavior, our system engineers are empowered to log, track, identify, publish, and ban misbehaving individuals - even if this leads to ban entire blocks of IP addresses, or disclosing user's identity.