arima backward selection laaggeschoolden | |||||||||||||||||||||||||||||||||||||||||||||||||||||||||||||||||||||||||||||||||||||||||||||||||||||||||||||||||||||||||||||||||||||||||||||||||||||||||||||||||||||||||||||||||||||||||||||||||||||||||||||||||||||||||||||||||||||||||||||||||||||||||||
| *The author of this computation has been verified* | |||||||||||||||||||||||||||||||||||||||||||||||||||||||||||||||||||||||||||||||||||||||||||||||||||||||||||||||||||||||||||||||||||||||||||||||||||||||||||||||||||||||||||||||||||||||||||||||||||||||||||||||||||||||||||||||||||||||||||||||||||||||||||
| R Software Module: /rwasp_arimabackwardselection.wasp (opens new window with default values) | |||||||||||||||||||||||||||||||||||||||||||||||||||||||||||||||||||||||||||||||||||||||||||||||||||||||||||||||||||||||||||||||||||||||||||||||||||||||||||||||||||||||||||||||||||||||||||||||||||||||||||||||||||||||||||||||||||||||||||||||||||||||||||
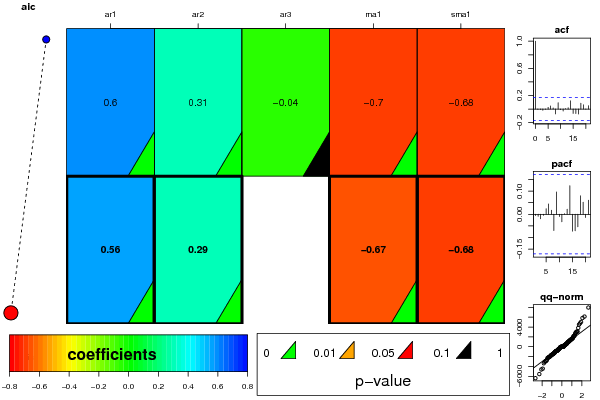
| Title produced by software: ARIMA Backward Selection | |||||||||||||||||||||||||||||||||||||||||||||||||||||||||||||||||||||||||||||||||||||||||||||||||||||||||||||||||||||||||||||||||||||||||||||||||||||||||||||||||||||||||||||||||||||||||||||||||||||||||||||||||||||||||||||||||||||||||||||||||||||||||||
| Date of computation: Wed, 22 Dec 2010 19:29:00 +0000 | |||||||||||||||||||||||||||||||||||||||||||||||||||||||||||||||||||||||||||||||||||||||||||||||||||||||||||||||||||||||||||||||||||||||||||||||||||||||||||||||||||||||||||||||||||||||||||||||||||||||||||||||||||||||||||||||||||||||||||||||||||||||||||
| Cite this page as follows: | |||||||||||||||||||||||||||||||||||||||||||||||||||||||||||||||||||||||||||||||||||||||||||||||||||||||||||||||||||||||||||||||||||||||||||||||||||||||||||||||||||||||||||||||||||||||||||||||||||||||||||||||||||||||||||||||||||||||||||||||||||||||||||
| Statistical Computations at FreeStatistics.org, Office for Research Development and Education, URL http://www.freestatistics.org/blog/date/2010/Dec/22/t12930460561x7maclm1t74g15.htm/, Retrieved Wed, 22 Dec 2010 20:27:37 +0100 | |||||||||||||||||||||||||||||||||||||||||||||||||||||||||||||||||||||||||||||||||||||||||||||||||||||||||||||||||||||||||||||||||||||||||||||||||||||||||||||||||||||||||||||||||||||||||||||||||||||||||||||||||||||||||||||||||||||||||||||||||||||||||||
| BibTeX entries for LaTeX users: | |||||||||||||||||||||||||||||||||||||||||||||||||||||||||||||||||||||||||||||||||||||||||||||||||||||||||||||||||||||||||||||||||||||||||||||||||||||||||||||||||||||||||||||||||||||||||||||||||||||||||||||||||||||||||||||||||||||||||||||||||||||||||||
@Manual{KEY,
    author = {{YOUR NAME}},
    publisher = {Office for Research Development and Education},
    title = {Statistical Computations at FreeStatistics.org, URL http://www.freestatistics.org/blog/date/2010/Dec/22/t12930460561x7maclm1t74g15.htm/},
    year = {2010},
}
@Manual{R,
    title = {R: A Language and Environment for Statistical Computing},
    author = {{R Development Core Team}},
    organization = {R Foundation for Statistical Computing},
    address = {Vienna, Austria},
    year = {2010},
    note = {{ISBN} 3-900051-07-0},
    url = {http://www.R-project.org},
}
| |||||||||||||||||||||||||||||||||||||||||||||||||||||||||||||||||||||||||||||||||||||||||||||||||||||||||||||||||||||||||||||||||||||||||||||||||||||||||||||||||||||||||||||||||||||||||||||||||||||||||||||||||||||||||||||||||||||||||||||||||||||||||||
| Original text written by user: | |||||||||||||||||||||||||||||||||||||||||||||||||||||||||||||||||||||||||||||||||||||||||||||||||||||||||||||||||||||||||||||||||||||||||||||||||||||||||||||||||||||||||||||||||||||||||||||||||||||||||||||||||||||||||||||||||||||||||||||||||||||||||||
| IsPrivate? | |||||||||||||||||||||||||||||||||||||||||||||||||||||||||||||||||||||||||||||||||||||||||||||||||||||||||||||||||||||||||||||||||||||||||||||||||||||||||||||||||||||||||||||||||||||||||||||||||||||||||||||||||||||||||||||||||||||||||||||||||||||||||||
| No (this computation is public) | |||||||||||||||||||||||||||||||||||||||||||||||||||||||||||||||||||||||||||||||||||||||||||||||||||||||||||||||||||||||||||||||||||||||||||||||||||||||||||||||||||||||||||||||||||||||||||||||||||||||||||||||||||||||||||||||||||||||||||||||||||||||||||
| User-defined keywords: | |||||||||||||||||||||||||||||||||||||||||||||||||||||||||||||||||||||||||||||||||||||||||||||||||||||||||||||||||||||||||||||||||||||||||||||||||||||||||||||||||||||||||||||||||||||||||||||||||||||||||||||||||||||||||||||||||||||||||||||||||||||||||||
| Dataseries X: | |||||||||||||||||||||||||||||||||||||||||||||||||||||||||||||||||||||||||||||||||||||||||||||||||||||||||||||||||||||||||||||||||||||||||||||||||||||||||||||||||||||||||||||||||||||||||||||||||||||||||||||||||||||||||||||||||||||||||||||||||||||||||||
| » Textbox « » Textfile « » CSV « | |||||||||||||||||||||||||||||||||||||||||||||||||||||||||||||||||||||||||||||||||||||||||||||||||||||||||||||||||||||||||||||||||||||||||||||||||||||||||||||||||||||||||||||||||||||||||||||||||||||||||||||||||||||||||||||||||||||||||||||||||||||||||||
| 104708 101817 97898 95559 92822 90848 101141 105841 93647 90923 89130 90212 93196 91861 90593 89895 88819 87924 96906 101217 98709 98139 95529 98577 100772 100180 99200 96251 94514 93780 105192 107682 99687 99436 102049 102673 105813 105056 103916 103513 101893 102503 113149 116696 108500 107800 105941 108742 111680 111270 110698 108517 107127 107088 116321 125045 116779 122887 120162 123198 123610 122293 121289 119393 117494 116693 125062 127281 120195 119804 117113 119240 115823 116281 113816 114632 112987 111633 116721 114850 112797 105368 102524 101327 102612 98873 95993 93244 90403 88539 98106 96963 90781 89253 87794 89810 90864 89025 87621 87718 83433 84535 92223 91052 88456 88706 89137 94066 99258 100673 102269 100833 99314 101764 108242 108148 104761 103772 103737 111043 109906 109335 107247 105690 102755 102280 110590 109122 102803 101424 99138 | |||||||||||||||||||||||||||||||||||||||||||||||||||||||||||||||||||||||||||||||||||||||||||||||||||||||||||||||||||||||||||||||||||||||||||||||||||||||||||||||||||||||||||||||||||||||||||||||||||||||||||||||||||||||||||||||||||||||||||||||||||||||||||
| Output produced by software: | |||||||||||||||||||||||||||||||||||||||||||||||||||||||||||||||||||||||||||||||||||||||||||||||||||||||||||||||||||||||||||||||||||||||||||||||||||||||||||||||||||||||||||||||||||||||||||||||||||||||||||||||||||||||||||||||||||||||||||||||||||||||||||
| |||||||||||||||||||||||||||||||||||||||||||||||||||||||||||||||||||||||||||||||||||||||||||||||||||||||||||||||||||||||||||||||||||||||||||||||||||||||||||||||||||||||||||||||||||||||||||||||||||||||||||||||||||||||||||||||||||||||||||||||||||||||||||
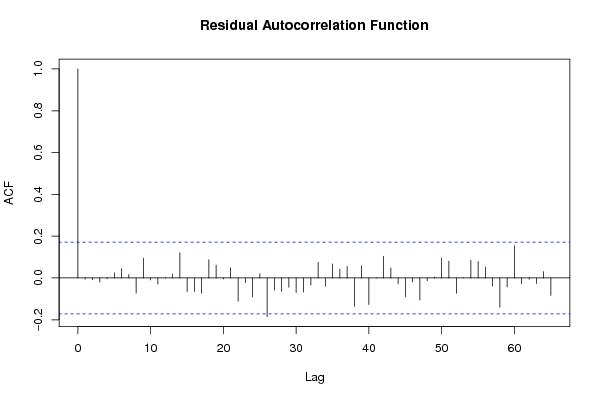
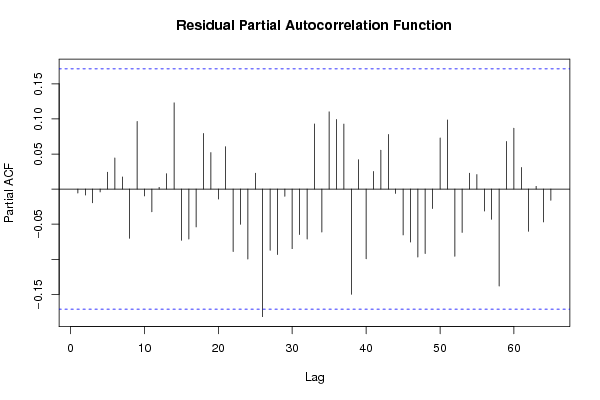
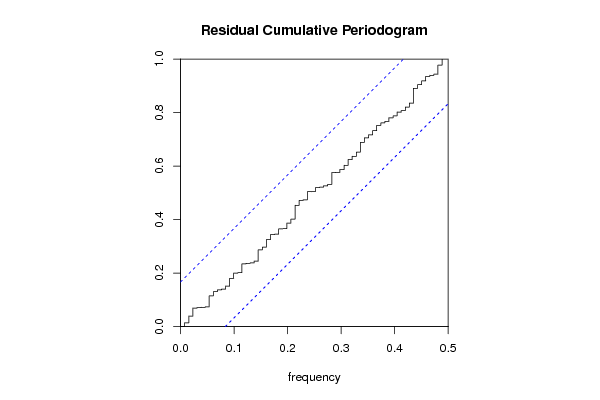
| Charts produced by software: | |||||||||||||||||||||||||||||||||||||||||||||||||||||||||||||||||||||||||||||||||||||||||||||||||||||||||||||||||||||||||||||||||||||||||||||||||||||||||||||||||||||||||||||||||||||||||||||||||||||||||||||||||||||||||||||||||||||||||||||||||||||||||||
| |||||||||||||||||||||||||||||||||||||||||||||||||||||||||||||||||||||||||||||||||||||||||||||||||||||||||||||||||||||||||||||||||||||||||||||||||||||||||||||||||||||||||||||||||||||||||||||||||||||||||||||||||||||||||||||||||||||||||||||||||||||||||||
| Parameters (Session): | |||||||||||||||||||||||||||||||||||||||||||||||||||||||||||||||||||||||||||||||||||||||||||||||||||||||||||||||||||||||||||||||||||||||||||||||||||||||||||||||||||||||||||||||||||||||||||||||||||||||||||||||||||||||||||||||||||||||||||||||||||||||||||
| par1 = FALSE ; par2 = 1 ; par3 = 1 ; par4 = 1 ; par5 = 12 ; par6 = 3 ; par7 = 1 ; par8 = 0 ; par9 = 1 ; | |||||||||||||||||||||||||||||||||||||||||||||||||||||||||||||||||||||||||||||||||||||||||||||||||||||||||||||||||||||||||||||||||||||||||||||||||||||||||||||||||||||||||||||||||||||||||||||||||||||||||||||||||||||||||||||||||||||||||||||||||||||||||||
| Parameters (R input): | |||||||||||||||||||||||||||||||||||||||||||||||||||||||||||||||||||||||||||||||||||||||||||||||||||||||||||||||||||||||||||||||||||||||||||||||||||||||||||||||||||||||||||||||||||||||||||||||||||||||||||||||||||||||||||||||||||||||||||||||||||||||||||
| par1 = FALSE ; par2 = 1 ; par3 = 1 ; par4 = 1 ; par5 = 12 ; par6 = 3 ; par7 = 1 ; par8 = 0 ; par9 = 1 ; | |||||||||||||||||||||||||||||||||||||||||||||||||||||||||||||||||||||||||||||||||||||||||||||||||||||||||||||||||||||||||||||||||||||||||||||||||||||||||||||||||||||||||||||||||||||||||||||||||||||||||||||||||||||||||||||||||||||||||||||||||||||||||||
| R code (references can be found in the software module): | |||||||||||||||||||||||||||||||||||||||||||||||||||||||||||||||||||||||||||||||||||||||||||||||||||||||||||||||||||||||||||||||||||||||||||||||||||||||||||||||||||||||||||||||||||||||||||||||||||||||||||||||||||||||||||||||||||||||||||||||||||||||||||
| library(lattice)
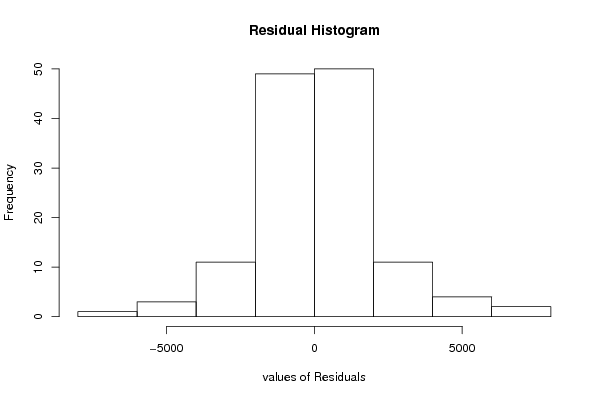
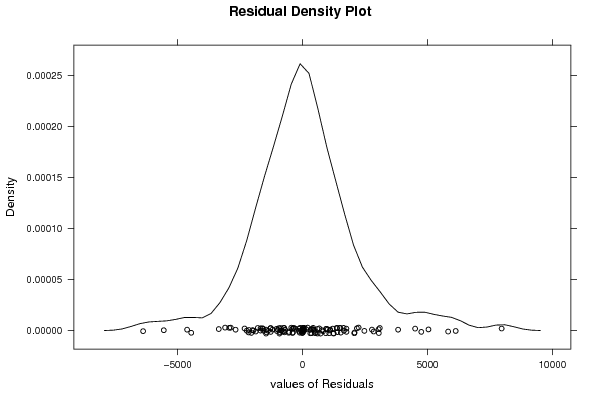
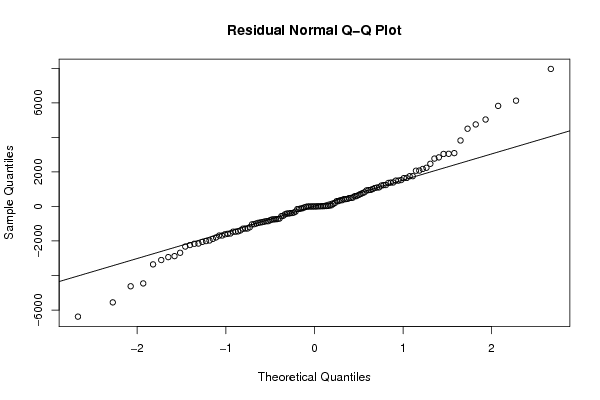
if (par1 == 'TRUE') par1 <- TRUE if (par1 == 'FALSE') par1 <- FALSE par2 <- as.numeric(par2) #Box-Cox lambda transformation parameter par3 <- as.numeric(par3) #degree of non-seasonal differencing par4 <- as.numeric(par4) #degree of seasonal differencing par5 <- as.numeric(par5) #seasonal period par6 <- as.numeric(par6) #degree (p) of the non-seasonal AR(p) polynomial par7 <- as.numeric(par7) #degree (q) of the non-seasonal MA(q) polynomial par8 <- as.numeric(par8) #degree (P) of the seasonal AR(P) polynomial par9 <- as.numeric(par9) #degree (Q) of the seasonal MA(Q) polynomial armaGR <- function(arima.out, names, n){ try1 <- arima.out$coef try2 <- sqrt(diag(arima.out$var.coef)) try.data.frame <- data.frame(matrix(NA,ncol=4,nrow=length(names))) dimnames(try.data.frame) <- list(names,c('coef','std','tstat','pv')) try.data.frame[,1] <- try1 for(i in 1:length(try2)) try.data.frame[which(rownames(try.data.frame)==names(try2)[i]),2] <- try2[i] try.data.frame[,3] <- try.data.frame[,1] / try.data.frame[,2] try.data.frame[,4] <- round((1-pt(abs(try.data.frame[,3]),df=n-(length(try2)+1)))*2,5) vector <- rep(NA,length(names)) vector[is.na(try.data.frame[,4])] <- 0 maxi <- which.max(try.data.frame[,4]) continue <- max(try.data.frame[,4],na.rm=TRUE) > .05 vector[maxi] <- 0 list(summary=try.data.frame,next.vector=vector,continue=continue) } arimaSelect <- function(series, order=c(13,0,0), seasonal=list(order=c(2,0,0),period=12), include.mean=F){ nrc <- order[1]+order[3]+seasonal$order[1]+seasonal$order[3] coeff <- matrix(NA, nrow=nrc*2, ncol=nrc) pval <- matrix(NA, nrow=nrc*2, ncol=nrc) mylist <- rep(list(NULL), nrc) names <- NULL if(order[1] > 0) names <- paste('ar',1:order[1],sep='') if(order[3] > 0) names <- c( names , paste('ma',1:order[3],sep='') ) if(seasonal$order[1] > 0) names <- c(names, paste('sar',1:seasonal$order[1],sep='')) if(seasonal$order[3] > 0) names <- c(names, paste('sma',1:seasonal$order[3],sep='')) arima.out <- arima(series, order=order, seasonal=seasonal, include.mean=include.mean, method='ML') mylist[[1]] <- arima.out last.arma <- armaGR(arima.out, names, length(series)) mystop <- FALSE i <- 1 coeff[i,] <- last.arma[[1]][,1] pval [i,] <- last.arma[[1]][,4] i <- 2 aic <- arima.out$aic while(!mystop){ mylist[[i]] <- arima.out arima.out <- arima(series, order=order, seasonal=seasonal, include.mean=include.mean, method='ML', fixed=last.arma$next.vector) aic <- c(aic, arima.out$aic) last.arma <- armaGR(arima.out, names, length(series)) mystop <- !last.arma$continue coeff[i,] <- last.arma[[1]][,1] pval [i,] <- last.arma[[1]][,4] i <- i+1 } list(coeff, pval, mylist, aic=aic) } arimaSelectplot <- function(arimaSelect.out,noms,choix){ noms <- names(arimaSelect.out[[3]][[1]]$coef) coeff <- arimaSelect.out[[1]] k <- min(which(is.na(coeff[,1])))-1 coeff <- coeff[1:k,] pval <- arimaSelect.out[[2]][1:k,] aic <- arimaSelect.out$aic[1:k] coeff[coeff==0] <- NA n <- ncol(coeff) if(missing(choix)) choix <- k layout(matrix(c(1,1,1,2, 3,3,3,2, 3,3,3,4, 5,6,7,7),nr=4), widths=c(10,35,45,15), heights=c(30,30,15,15)) couleurs <- rainbow(75)[1:50]#(50) ticks <- pretty(coeff) par(mar=c(1,1,3,1)) plot(aic,k:1-.5,type='o',pch=21,bg='blue',cex=2,axes=F,lty=2,xpd=NA) points(aic[choix],k-choix+.5,pch=21,cex=4,bg=2,xpd=NA) title('aic',line=2) par(mar=c(3,0,0,0)) plot(0,axes=F,xlab='',ylab='',xlim=range(ticks),ylim=c(.1,1)) rect(xleft = min(ticks) + (0:49)/50*(max(ticks)-min(ticks)), xright = min(ticks) + (1:50)/50*(max(ticks)-min(ticks)), ytop = rep(1,50), ybottom= rep(0,50),col=couleurs,border=NA) axis(1,ticks) rect(xleft=min(ticks),xright=max(ticks),ytop=1,ybottom=0) text(mean(coeff,na.rm=T),.5,'coefficients',cex=2,font=2) par(mar=c(1,1,3,1)) image(1:n,1:k,t(coeff[k:1,]),axes=F,col=couleurs,zlim=range(ticks)) for(i in 1:n) for(j in 1:k) if(!is.na(coeff[j,i])) { if(pval[j,i]<.01) symb = 'green' else if( (pval[j,i]<.05) & (pval[j,i]>=.01)) symb = 'orange' else if( (pval[j,i]<.1) & (pval[j,i]>=.05)) symb = 'red' else symb = 'black' polygon(c(i+.5 ,i+.2 ,i+.5 ,i+.5), c(k-j+0.5,k-j+0.5,k-j+0.8,k-j+0.5), col=symb) if(j==choix) { rect(xleft=i-.5, xright=i+.5, ybottom=k-j+1.5, ytop=k-j+.5, lwd=4) text(i, k-j+1, round(coeff[j,i],2), cex=1.2, font=2) } else{ rect(xleft=i-.5,xright=i+.5,ybottom=k-j+1.5,ytop=k-j+.5) text(i,k-j+1,round(coeff[j,i],2),cex=1.2,font=1) } } axis(3,1:n,noms) par(mar=c(0.5,0,0,0.5)) plot(0,axes=F,xlab='',ylab='',type='n',xlim=c(0,8),ylim=c(-.2,.8)) cols <- c('green','orange','red','black') niv <- c('0','0.01','0.05','0.1') for(i in 0:3){ polygon(c(1+2*i ,1+2*i ,1+2*i-.5 ,1+2*i), c(.4 ,.7 , .4 , .4), col=cols[i+1]) text(2*i,0.5,niv[i+1],cex=1.5) } text(8,.5,1,cex=1.5) text(4,0,'p-value',cex=2) box() residus <- arimaSelect.out[[3]][[choix]]$res par(mar=c(1,2,4,1)) acf(residus,main='') title('acf',line=.5) par(mar=c(1,2,4,1)) pacf(residus,main='') title('pacf',line=.5) par(mar=c(2,2,4,1)) qqnorm(residus,main='') title('qq-norm',line=.5) qqline(residus) residus } if (par2 == 0) x <- log(x) if (par2 != 0) x <- x^par2 (selection <- arimaSelect(x, order=c(par6,par3,par7), seasonal=list(order=c(par8,par4,par9), period=par5))) bitmap(file='test1.png') resid <- arimaSelectplot(selection) dev.off() resid bitmap(file='test2.png') acf(resid,length(resid)/2, main='Residual Autocorrelation Function') dev.off() bitmap(file='test3.png') pacf(resid,length(resid)/2, main='Residual Partial Autocorrelation Function') dev.off() bitmap(file='test4.png') cpgram(resid, main='Residual Cumulative Periodogram') dev.off() bitmap(file='test5.png') hist(resid, main='Residual Histogram', xlab='values of Residuals') dev.off() bitmap(file='test6.png') densityplot(~resid,col='black',main='Residual Density Plot', xlab='values of Residuals') dev.off() bitmap(file='test7.png') qqnorm(resid, main='Residual Normal Q-Q Plot') qqline(resid) dev.off() ncols <- length(selection[[1]][1,]) nrows <- length(selection[[2]][,1])-1 load(file='createtable') a<-table.start() a<-table.row.start(a) a<-table.element(a,'ARIMA Parameter Estimation and Backward Selection', ncols+1,TRUE) a<-table.row.end(a) a<-table.row.start(a) a<-table.element(a,'Iteration', header=TRUE) for (i in 1:ncols) { a<-table.element(a,names(selection[[3]][[1]]$coef)[i],header=TRUE) } a<-table.row.end(a) for (j in 1:nrows) { a<-table.row.start(a) mydum <- 'Estimates (' mydum <- paste(mydum,j) mydum <- paste(mydum,')') a<-table.element(a,mydum, header=TRUE) for (i in 1:ncols) { a<-table.element(a,round(selection[[1]][j,i],4)) } a<-table.row.end(a) a<-table.row.start(a) a<-table.element(a,'(p-val)', header=TRUE) for (i in 1:ncols) { mydum <- '(' mydum <- paste(mydum,round(selection[[2]][j,i],4),sep='') mydum <- paste(mydum,')') a<-table.element(a,mydum) } a<-table.row.end(a) } a<-table.end(a) table.save(a,file='mytable.tab') a<-table.start() a<-table.row.start(a) a<-table.element(a,'Estimated ARIMA Residuals', 1,TRUE) a<-table.row.end(a) a<-table.row.start(a) a<-table.element(a,'Value', 1,TRUE) a<-table.row.end(a) for (i in (par4*par5+par3):length(resid)) { a<-table.row.start(a) a<-table.element(a,resid[i]) a<-table.row.end(a) } a<-table.end(a) table.save(a,file='mytable1.tab') | |||||||||||||||||||||||||||||||||||||||||||||||||||||||||||||||||||||||||||||||||||||||||||||||||||||||||||||||||||||||||||||||||||||||||||||||||||||||||||||||||||||||||||||||||||||||||||||||||||||||||||||||||||||||||||||||||||||||||||||||||||||||||||
Copyright

This work is licensed under a
Creative Commons Attribution-Noncommercial-Share Alike 3.0 License.
Software written by Ed van Stee & Patrick Wessa
Disclaimer
Information provided on this web site is provided "AS IS" without warranty of any kind, either express or implied, including, without limitation, warranties of merchantability, fitness for a particular purpose, and noninfringement. We use reasonable efforts to include accurate and timely information and periodically update the information, and software without notice. However, we make no warranties or representations as to the accuracy or completeness of such information (or software), and we assume no liability or responsibility for errors or omissions in the content of this web site, or any software bugs in online applications. Your use of this web site is AT YOUR OWN RISK. Under no circumstances and under no legal theory shall we be liable to you or any other person for any direct, indirect, special, incidental, exemplary, or consequential damages arising from your access to, or use of, this web site.
Privacy Policy
We may request personal information to be submitted to our servers in order to be able to:
- personalize online software applications according to your needs
- enforce strict security rules with respect to the data that you upload (e.g. statistical data)
- manage user sessions of online applications
- alert you about important changes or upgrades in resources or applications
We NEVER allow other companies to directly offer registered users information about their products and services. Banner references and hyperlinks of third parties NEVER contain any personal data of the visitor.
We do NOT sell, nor transmit by any means, personal information, nor statistical data series uploaded by you to third parties.
We carefully protect your data from loss, misuse, alteration,
and destruction. However, at any time, and under any circumstance you
are solely responsible for managing your passwords, and keeping them
secret.
We store a unique ANONYMOUS USER ID in the form of a small 'Cookie' on your computer. This allows us to track your progress when using this website which is necessary to create state-dependent features. The cookie is used for NO OTHER PURPOSE. At any time you may opt to disallow cookies from this website - this will not affect other features of this website.
We examine cookies that are used by third-parties (banner and online ads) very closely: abuse from third-parties automatically results in termination of the advertising contract without refund. We have very good reason to believe that the cookies that are produced by third parties (banner ads) do NOT cause any privacy or security risk.
FreeStatistics.org is safe. There is no need to download any software to use the applications and services contained in this website. Hence, your system's security is not compromised by their use, and your personal data - other than data you submit in the account application form, and the user-agent information that is transmitted by your browser - is never transmitted to our servers.
As a general rule, we do not log on-line behavior of individuals (other than normal logging of webserver 'hits'). However, in cases of abuse, hacking, unauthorized access, Denial of Service attacks, illegal copying, hotlinking, non-compliance with international webstandards (such as robots.txt), or any other harmful behavior, our system engineers are empowered to log, track, identify, publish, and ban misbehaving individuals - even if this leads to ban entire blocks of IP addresses, or disclosing user's identity.