Recursieve Partitioning | ||||||||||||||||||||||||||||||||||||||||||||||||||||||||||||||||||||||||||||||||||||||||||||||||||||||||||||||||||||||||||||||||||||||||||||||||||||||||||||||||||||||||||||||||||||||||||||||||||||||||||||||||||||||||||||||||||||||||||||||||||||||||||||||||||||||||||||||||||||||||||||||||||||||||||||||||||||||||||||||||||||||||||||||||||||||||||||||||||||||||||||||||||||||||||||||||||||||||||||||||||||||||||||||||||||||||||||||||||||||||||||||||||||||||||||||||||||||||||||||||||||||||||||||||||||||||||||||||||||||||||||||||||||||||||||||||||||||
| *The author of this computation has been verified* | ||||||||||||||||||||||||||||||||||||||||||||||||||||||||||||||||||||||||||||||||||||||||||||||||||||||||||||||||||||||||||||||||||||||||||||||||||||||||||||||||||||||||||||||||||||||||||||||||||||||||||||||||||||||||||||||||||||||||||||||||||||||||||||||||||||||||||||||||||||||||||||||||||||||||||||||||||||||||||||||||||||||||||||||||||||||||||||||||||||||||||||||||||||||||||||||||||||||||||||||||||||||||||||||||||||||||||||||||||||||||||||||||||||||||||||||||||||||||||||||||||||||||||||||||||||||||||||||||||||||||||||||||||||||||||||||||||||||
| R Software Module: /rwasp_regression_trees1.wasp (opens new window with default values) | ||||||||||||||||||||||||||||||||||||||||||||||||||||||||||||||||||||||||||||||||||||||||||||||||||||||||||||||||||||||||||||||||||||||||||||||||||||||||||||||||||||||||||||||||||||||||||||||||||||||||||||||||||||||||||||||||||||||||||||||||||||||||||||||||||||||||||||||||||||||||||||||||||||||||||||||||||||||||||||||||||||||||||||||||||||||||||||||||||||||||||||||||||||||||||||||||||||||||||||||||||||||||||||||||||||||||||||||||||||||||||||||||||||||||||||||||||||||||||||||||||||||||||||||||||||||||||||||||||||||||||||||||||||||||||||||||||||||
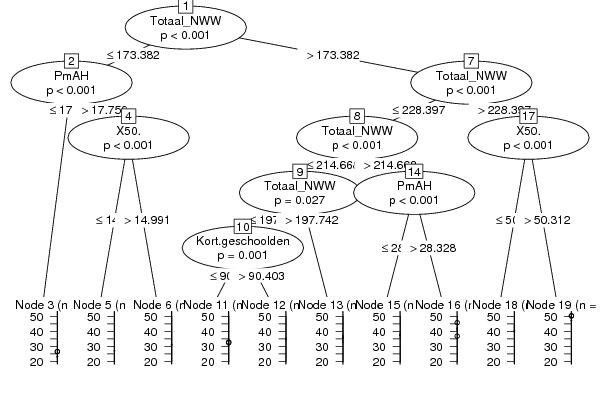
| Title produced by software: Recursive Partitioning (Regression Trees) | ||||||||||||||||||||||||||||||||||||||||||||||||||||||||||||||||||||||||||||||||||||||||||||||||||||||||||||||||||||||||||||||||||||||||||||||||||||||||||||||||||||||||||||||||||||||||||||||||||||||||||||||||||||||||||||||||||||||||||||||||||||||||||||||||||||||||||||||||||||||||||||||||||||||||||||||||||||||||||||||||||||||||||||||||||||||||||||||||||||||||||||||||||||||||||||||||||||||||||||||||||||||||||||||||||||||||||||||||||||||||||||||||||||||||||||||||||||||||||||||||||||||||||||||||||||||||||||||||||||||||||||||||||||||||||||||||||||||
| Date of computation: Mon, 20 Dec 2010 13:43:03 +0000 | ||||||||||||||||||||||||||||||||||||||||||||||||||||||||||||||||||||||||||||||||||||||||||||||||||||||||||||||||||||||||||||||||||||||||||||||||||||||||||||||||||||||||||||||||||||||||||||||||||||||||||||||||||||||||||||||||||||||||||||||||||||||||||||||||||||||||||||||||||||||||||||||||||||||||||||||||||||||||||||||||||||||||||||||||||||||||||||||||||||||||||||||||||||||||||||||||||||||||||||||||||||||||||||||||||||||||||||||||||||||||||||||||||||||||||||||||||||||||||||||||||||||||||||||||||||||||||||||||||||||||||||||||||||||||||||||||||||||
| Cite this page as follows: | ||||||||||||||||||||||||||||||||||||||||||||||||||||||||||||||||||||||||||||||||||||||||||||||||||||||||||||||||||||||||||||||||||||||||||||||||||||||||||||||||||||||||||||||||||||||||||||||||||||||||||||||||||||||||||||||||||||||||||||||||||||||||||||||||||||||||||||||||||||||||||||||||||||||||||||||||||||||||||||||||||||||||||||||||||||||||||||||||||||||||||||||||||||||||||||||||||||||||||||||||||||||||||||||||||||||||||||||||||||||||||||||||||||||||||||||||||||||||||||||||||||||||||||||||||||||||||||||||||||||||||||||||||||||||||||||||||||||
| Statistical Computations at FreeStatistics.org, Office for Research Development and Education, URL http://www.freestatistics.org/blog/date/2010/Dec/20/t1292852632a1krzwwp3jnlsia.htm/, Retrieved Mon, 20 Dec 2010 14:43:52 +0100 | ||||||||||||||||||||||||||||||||||||||||||||||||||||||||||||||||||||||||||||||||||||||||||||||||||||||||||||||||||||||||||||||||||||||||||||||||||||||||||||||||||||||||||||||||||||||||||||||||||||||||||||||||||||||||||||||||||||||||||||||||||||||||||||||||||||||||||||||||||||||||||||||||||||||||||||||||||||||||||||||||||||||||||||||||||||||||||||||||||||||||||||||||||||||||||||||||||||||||||||||||||||||||||||||||||||||||||||||||||||||||||||||||||||||||||||||||||||||||||||||||||||||||||||||||||||||||||||||||||||||||||||||||||||||||||||||||||||||
| BibTeX entries for LaTeX users: | ||||||||||||||||||||||||||||||||||||||||||||||||||||||||||||||||||||||||||||||||||||||||||||||||||||||||||||||||||||||||||||||||||||||||||||||||||||||||||||||||||||||||||||||||||||||||||||||||||||||||||||||||||||||||||||||||||||||||||||||||||||||||||||||||||||||||||||||||||||||||||||||||||||||||||||||||||||||||||||||||||||||||||||||||||||||||||||||||||||||||||||||||||||||||||||||||||||||||||||||||||||||||||||||||||||||||||||||||||||||||||||||||||||||||||||||||||||||||||||||||||||||||||||||||||||||||||||||||||||||||||||||||||||||||||||||||||||||
@Manual{KEY,
    author = {{YOUR NAME}},
    publisher = {Office for Research Development and Education},
    title = {Statistical Computations at FreeStatistics.org, URL http://www.freestatistics.org/blog/date/2010/Dec/20/t1292852632a1krzwwp3jnlsia.htm/},
    year = {2010},
}
@Manual{R,
    title = {R: A Language and Environment for Statistical Computing},
    author = {{R Development Core Team}},
    organization = {R Foundation for Statistical Computing},
    address = {Vienna, Austria},
    year = {2010},
    note = {{ISBN} 3-900051-07-0},
    url = {http://www.R-project.org},
}
| ||||||||||||||||||||||||||||||||||||||||||||||||||||||||||||||||||||||||||||||||||||||||||||||||||||||||||||||||||||||||||||||||||||||||||||||||||||||||||||||||||||||||||||||||||||||||||||||||||||||||||||||||||||||||||||||||||||||||||||||||||||||||||||||||||||||||||||||||||||||||||||||||||||||||||||||||||||||||||||||||||||||||||||||||||||||||||||||||||||||||||||||||||||||||||||||||||||||||||||||||||||||||||||||||||||||||||||||||||||||||||||||||||||||||||||||||||||||||||||||||||||||||||||||||||||||||||||||||||||||||||||||||||||||||||||||||||||||
| Original text written by user: | ||||||||||||||||||||||||||||||||||||||||||||||||||||||||||||||||||||||||||||||||||||||||||||||||||||||||||||||||||||||||||||||||||||||||||||||||||||||||||||||||||||||||||||||||||||||||||||||||||||||||||||||||||||||||||||||||||||||||||||||||||||||||||||||||||||||||||||||||||||||||||||||||||||||||||||||||||||||||||||||||||||||||||||||||||||||||||||||||||||||||||||||||||||||||||||||||||||||||||||||||||||||||||||||||||||||||||||||||||||||||||||||||||||||||||||||||||||||||||||||||||||||||||||||||||||||||||||||||||||||||||||||||||||||||||||||||||||||
| IsPrivate? | ||||||||||||||||||||||||||||||||||||||||||||||||||||||||||||||||||||||||||||||||||||||||||||||||||||||||||||||||||||||||||||||||||||||||||||||||||||||||||||||||||||||||||||||||||||||||||||||||||||||||||||||||||||||||||||||||||||||||||||||||||||||||||||||||||||||||||||||||||||||||||||||||||||||||||||||||||||||||||||||||||||||||||||||||||||||||||||||||||||||||||||||||||||||||||||||||||||||||||||||||||||||||||||||||||||||||||||||||||||||||||||||||||||||||||||||||||||||||||||||||||||||||||||||||||||||||||||||||||||||||||||||||||||||||||||||||||||||
| No (this computation is public) | ||||||||||||||||||||||||||||||||||||||||||||||||||||||||||||||||||||||||||||||||||||||||||||||||||||||||||||||||||||||||||||||||||||||||||||||||||||||||||||||||||||||||||||||||||||||||||||||||||||||||||||||||||||||||||||||||||||||||||||||||||||||||||||||||||||||||||||||||||||||||||||||||||||||||||||||||||||||||||||||||||||||||||||||||||||||||||||||||||||||||||||||||||||||||||||||||||||||||||||||||||||||||||||||||||||||||||||||||||||||||||||||||||||||||||||||||||||||||||||||||||||||||||||||||||||||||||||||||||||||||||||||||||||||||||||||||||||||
| User-defined keywords: | ||||||||||||||||||||||||||||||||||||||||||||||||||||||||||||||||||||||||||||||||||||||||||||||||||||||||||||||||||||||||||||||||||||||||||||||||||||||||||||||||||||||||||||||||||||||||||||||||||||||||||||||||||||||||||||||||||||||||||||||||||||||||||||||||||||||||||||||||||||||||||||||||||||||||||||||||||||||||||||||||||||||||||||||||||||||||||||||||||||||||||||||||||||||||||||||||||||||||||||||||||||||||||||||||||||||||||||||||||||||||||||||||||||||||||||||||||||||||||||||||||||||||||||||||||||||||||||||||||||||||||||||||||||||||||||||||||||||
| Dataseries X: | ||||||||||||||||||||||||||||||||||||||||||||||||||||||||||||||||||||||||||||||||||||||||||||||||||||||||||||||||||||||||||||||||||||||||||||||||||||||||||||||||||||||||||||||||||||||||||||||||||||||||||||||||||||||||||||||||||||||||||||||||||||||||||||||||||||||||||||||||||||||||||||||||||||||||||||||||||||||||||||||||||||||||||||||||||||||||||||||||||||||||||||||||||||||||||||||||||||||||||||||||||||||||||||||||||||||||||||||||||||||||||||||||||||||||||||||||||||||||||||||||||||||||||||||||||||||||||||||||||||||||||||||||||||||||||||||||||||||
| » Textbox « » Textfile « » CSV « | ||||||||||||||||||||||||||||||||||||||||||||||||||||||||||||||||||||||||||||||||||||||||||||||||||||||||||||||||||||||||||||||||||||||||||||||||||||||||||||||||||||||||||||||||||||||||||||||||||||||||||||||||||||||||||||||||||||||||||||||||||||||||||||||||||||||||||||||||||||||||||||||||||||||||||||||||||||||||||||||||||||||||||||||||||||||||||||||||||||||||||||||||||||||||||||||||||||||||||||||||||||||||||||||||||||||||||||||||||||||||||||||||||||||||||||||||||||||||||||||||||||||||||||||||||||||||||||||||||||||||||||||||||||||||||||||||||||||
| 22.037 17.759 14.116 104.708 158.620 21.732 17.530 13.504 101.817 154.583 21.172 17.139 13.168 97.898 149.377 21.388 16.916 13.064 95.559 146.927 22.053 16.543 12.828 92.822 144.246 22.687 16.317 12.541 90.848 142.393 24.793 18.161 13.547 101.141 157.642 26.113 19.144 13.710 105.841 164.808 23.708 16.947 12.535 93.647 146.837 23.554 16.491 12.386 90.923 143.354 23.222 16.428 12.253 89.130 141.033 23.363 16.639 12.484 90.212 142.698 24.023 16.821 12.966 93.196 147.006 23.355 16.765 12.770 91.861 144.751 23.276 16.533 12.660 90.593 143.062 23.085 16.554 12.514 89.895 142.048 23.173 16.494 12.430 88.819 140.916 23.487 16.612 12.372 87.924 140.395 25.576 17.933 13.085 96.906 153.500 26.311 19.070 13.454 101.217 160.052 27.109 18.179 13.361 98.709 157.358 27.060 17.830 13.713 98.139 156.742 26.490 17.349 13.601 95.529 152.969 27.157 17.919 14.090 98.577 157.743 26.973 18.269 14.452 100.772 160.466 27.589 18.385 14.108 100.180 160.262 27.246 18.260 14.036 99.200 158.742 26.845 17.905 13.3 etc... | ||||||||||||||||||||||||||||||||||||||||||||||||||||||||||||||||||||||||||||||||||||||||||||||||||||||||||||||||||||||||||||||||||||||||||||||||||||||||||||||||||||||||||||||||||||||||||||||||||||||||||||||||||||||||||||||||||||||||||||||||||||||||||||||||||||||||||||||||||||||||||||||||||||||||||||||||||||||||||||||||||||||||||||||||||||||||||||||||||||||||||||||||||||||||||||||||||||||||||||||||||||||||||||||||||||||||||||||||||||||||||||||||||||||||||||||||||||||||||||||||||||||||||||||||||||||||||||||||||||||||||||||||||||||||||||||||||||||
| Output produced by software: | ||||||||||||||||||||||||||||||||||||||||||||||||||||||||||||||||||||||||||||||||||||||||||||||||||||||||||||||||||||||||||||||||||||||||||||||||||||||||||||||||||||||||||||||||||||||||||||||||||||||||||||||||||||||||||||||||||||||||||||||||||||||||||||||||||||||||||||||||||||||||||||||||||||||||||||||||||||||||||||||||||||||||||||||||||||||||||||||||||||||||||||||||||||||||||||||||||||||||||||||||||||||||||||||||||||||||||||||||||||||||||||||||||||||||||||||||||||||||||||||||||||||||||||||||||||||||||||||||||||||||||||||||||||||||||||||||||||||
Enter (or paste) a matrix (table) containing all data (time) series. Every column represents a different variable and must be delimited by a space or Tab. Every row represents a period in time (or category) and must be delimited by hard returns. The easiest way to enter data is to copy and paste a block of spreadsheet cells. Please, do not use commas or spaces to seperate groups of digits!
| ||||||||||||||||||||||||||||||||||||||||||||||||||||||||||||||||||||||||||||||||||||||||||||||||||||||||||||||||||||||||||||||||||||||||||||||||||||||||||||||||||||||||||||||||||||||||||||||||||||||||||||||||||||||||||||||||||||||||||||||||||||||||||||||||||||||||||||||||||||||||||||||||||||||||||||||||||||||||||||||||||||||||||||||||||||||||||||||||||||||||||||||||||||||||||||||||||||||||||||||||||||||||||||||||||||||||||||||||||||||||||||||||||||||||||||||||||||||||||||||||||||||||||||||||||||||||||||||||||||||||||||||||||||||||||||||||||||||
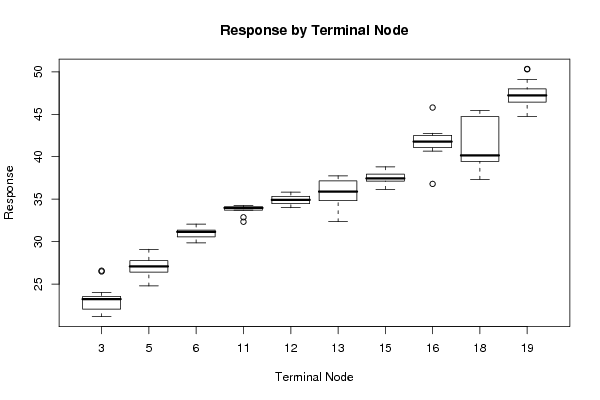
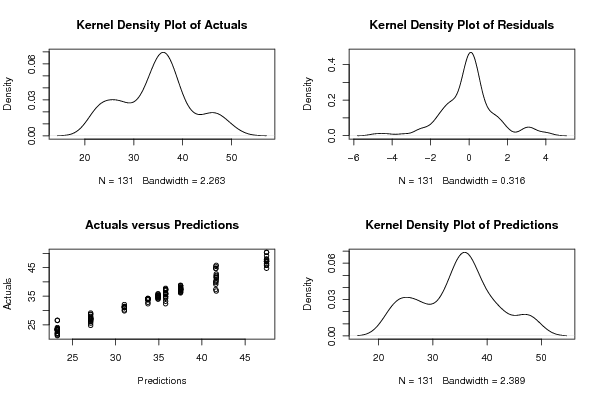
| Charts produced by software: | ||||||||||||||||||||||||||||||||||||||||||||||||||||||||||||||||||||||||||||||||||||||||||||||||||||||||||||||||||||||||||||||||||||||||||||||||||||||||||||||||||||||||||||||||||||||||||||||||||||||||||||||||||||||||||||||||||||||||||||||||||||||||||||||||||||||||||||||||||||||||||||||||||||||||||||||||||||||||||||||||||||||||||||||||||||||||||||||||||||||||||||||||||||||||||||||||||||||||||||||||||||||||||||||||||||||||||||||||||||||||||||||||||||||||||||||||||||||||||||||||||||||||||||||||||||||||||||||||||||||||||||||||||||||||||||||||||||||
| ||||||||||||||||||||||||||||||||||||||||||||||||||||||||||||||||||||||||||||||||||||||||||||||||||||||||||||||||||||||||||||||||||||||||||||||||||||||||||||||||||||||||||||||||||||||||||||||||||||||||||||||||||||||||||||||||||||||||||||||||||||||||||||||||||||||||||||||||||||||||||||||||||||||||||||||||||||||||||||||||||||||||||||||||||||||||||||||||||||||||||||||||||||||||||||||||||||||||||||||||||||||||||||||||||||||||||||||||||||||||||||||||||||||||||||||||||||||||||||||||||||||||||||||||||||||||||||||||||||||||||||||||||||||||||||||||||||||
| Parameters (Session): | ||||||||||||||||||||||||||||||||||||||||||||||||||||||||||||||||||||||||||||||||||||||||||||||||||||||||||||||||||||||||||||||||||||||||||||||||||||||||||||||||||||||||||||||||||||||||||||||||||||||||||||||||||||||||||||||||||||||||||||||||||||||||||||||||||||||||||||||||||||||||||||||||||||||||||||||||||||||||||||||||||||||||||||||||||||||||||||||||||||||||||||||||||||||||||||||||||||||||||||||||||||||||||||||||||||||||||||||||||||||||||||||||||||||||||||||||||||||||||||||||||||||||||||||||||||||||||||||||||||||||||||||||||||||||||||||||||||||
| par1 = 1 ; par2 = none ; par3 = 3 ; par4 = no ; | ||||||||||||||||||||||||||||||||||||||||||||||||||||||||||||||||||||||||||||||||||||||||||||||||||||||||||||||||||||||||||||||||||||||||||||||||||||||||||||||||||||||||||||||||||||||||||||||||||||||||||||||||||||||||||||||||||||||||||||||||||||||||||||||||||||||||||||||||||||||||||||||||||||||||||||||||||||||||||||||||||||||||||||||||||||||||||||||||||||||||||||||||||||||||||||||||||||||||||||||||||||||||||||||||||||||||||||||||||||||||||||||||||||||||||||||||||||||||||||||||||||||||||||||||||||||||||||||||||||||||||||||||||||||||||||||||||||||
| Parameters (R input): | ||||||||||||||||||||||||||||||||||||||||||||||||||||||||||||||||||||||||||||||||||||||||||||||||||||||||||||||||||||||||||||||||||||||||||||||||||||||||||||||||||||||||||||||||||||||||||||||||||||||||||||||||||||||||||||||||||||||||||||||||||||||||||||||||||||||||||||||||||||||||||||||||||||||||||||||||||||||||||||||||||||||||||||||||||||||||||||||||||||||||||||||||||||||||||||||||||||||||||||||||||||||||||||||||||||||||||||||||||||||||||||||||||||||||||||||||||||||||||||||||||||||||||||||||||||||||||||||||||||||||||||||||||||||||||||||||||||||
| par1 = 1 ; par2 = none ; par3 = 3 ; par4 = no ; | ||||||||||||||||||||||||||||||||||||||||||||||||||||||||||||||||||||||||||||||||||||||||||||||||||||||||||||||||||||||||||||||||||||||||||||||||||||||||||||||||||||||||||||||||||||||||||||||||||||||||||||||||||||||||||||||||||||||||||||||||||||||||||||||||||||||||||||||||||||||||||||||||||||||||||||||||||||||||||||||||||||||||||||||||||||||||||||||||||||||||||||||||||||||||||||||||||||||||||||||||||||||||||||||||||||||||||||||||||||||||||||||||||||||||||||||||||||||||||||||||||||||||||||||||||||||||||||||||||||||||||||||||||||||||||||||||||||||
| R code (references can be found in the software module): | ||||||||||||||||||||||||||||||||||||||||||||||||||||||||||||||||||||||||||||||||||||||||||||||||||||||||||||||||||||||||||||||||||||||||||||||||||||||||||||||||||||||||||||||||||||||||||||||||||||||||||||||||||||||||||||||||||||||||||||||||||||||||||||||||||||||||||||||||||||||||||||||||||||||||||||||||||||||||||||||||||||||||||||||||||||||||||||||||||||||||||||||||||||||||||||||||||||||||||||||||||||||||||||||||||||||||||||||||||||||||||||||||||||||||||||||||||||||||||||||||||||||||||||||||||||||||||||||||||||||||||||||||||||||||||||||||||||||
| library(party)
library(Hmisc) par1 <- as.numeric(par1) par3 <- as.numeric(par3) x <- data.frame(t(y)) is.data.frame(x) x <- x[!is.na(x[,par1]),] k <- length(x[1,]) n <- length(x[,1]) colnames(x)[par1] x[,par1] if (par2 == 'kmeans') { cl <- kmeans(x[,par1], par3) print(cl) clm <- matrix(cbind(cl$centers,1:par3),ncol=2) clm <- clm[sort.list(clm[,1]),] for (i in 1:par3) { cl$cluster[cl$cluster==clm[i,2]] <- paste('C',i,sep='') } cl$cluster <- as.factor(cl$cluster) print(cl$cluster) x[,par1] <- cl$cluster } if (par2 == 'quantiles') { x[,par1] <- cut2(x[,par1],g=par3) } if (par2 == 'hclust') { hc <- hclust(dist(x[,par1])^2, 'cen') print(hc) memb <- cutree(hc, k = par3) dum <- c(mean(x[memb==1,par1])) for (i in 2:par3) { dum <- c(dum, mean(x[memb==i,par1])) } hcm <- matrix(cbind(dum,1:par3),ncol=2) hcm <- hcm[sort.list(hcm[,1]),] for (i in 1:par3) { memb[memb==hcm[i,2]] <- paste('C',i,sep='') } memb <- as.factor(memb) print(memb) x[,par1] <- memb } if (par2=='equal') { ed <- cut(as.numeric(x[,par1]),par3,labels=paste('C',1:par3,sep='')) x[,par1] <- as.factor(ed) } table(x[,par1]) colnames(x) colnames(x)[par1] x[,par1] if (par2 == 'none') { m <- ctree(as.formula(paste(colnames(x)[par1],' ~ .',sep='')),data = x) } load(file='createtable') if (par2 != 'none') { m <- ctree(as.formula(paste('as.factor(',colnames(x)[par1],') ~ .',sep='')),data = x) if (par4=='yes') { a<-table.start() a<-table.row.start(a) a<-table.element(a,'10-Fold Cross Validation',3+2*par3,TRUE) a<-table.row.end(a) a<-table.row.start(a) a<-table.element(a,'',1,TRUE) a<-table.element(a,'Prediction (training)',par3+1,TRUE) a<-table.element(a,'Prediction (testing)',par3+1,TRUE) a<-table.row.end(a) a<-table.row.start(a) a<-table.element(a,'Actual',1,TRUE) for (jjj in 1:par3) a<-table.element(a,paste('C',jjj,sep=''),1,TRUE) a<-table.element(a,'CV',1,TRUE) for (jjj in 1:par3) a<-table.element(a,paste('C',jjj,sep=''),1,TRUE) a<-table.element(a,'CV',1,TRUE) a<-table.row.end(a) for (i in 1:10) { ind <- sample(2, nrow(x), replace=T, prob=c(0.9,0.1)) m.ct <- ctree(as.formula(paste('as.factor(',colnames(x)[par1],') ~ .',sep='')),data =x[ind==1,]) if (i==1) { m.ct.i.pred <- predict(m.ct, newdata=x[ind==1,]) m.ct.i.actu <- x[ind==1,par1] m.ct.x.pred <- predict(m.ct, newdata=x[ind==2,]) m.ct.x.actu <- x[ind==2,par1] } else { m.ct.i.pred <- c(m.ct.i.pred,predict(m.ct, newdata=x[ind==1,])) m.ct.i.actu <- c(m.ct.i.actu,x[ind==1,par1]) m.ct.x.pred <- c(m.ct.x.pred,predict(m.ct, newdata=x[ind==2,])) m.ct.x.actu <- c(m.ct.x.actu,x[ind==2,par1]) } } print(m.ct.i.tab <- table(m.ct.i.actu,m.ct.i.pred)) numer <- 0 for (i in 1:par3) { print(m.ct.i.tab[i,i] / sum(m.ct.i.tab[i,])) numer <- numer + m.ct.i.tab[i,i] } print(m.ct.i.cp <- numer / sum(m.ct.i.tab)) print(m.ct.x.tab <- table(m.ct.x.actu,m.ct.x.pred)) numer <- 0 for (i in 1:par3) { print(m.ct.x.tab[i,i] / sum(m.ct.x.tab[i,])) numer <- numer + m.ct.x.tab[i,i] } print(m.ct.x.cp <- numer / sum(m.ct.x.tab)) for (i in 1:par3) { a<-table.row.start(a) a<-table.element(a,paste('C',i,sep=''),1,TRUE) for (jjj in 1:par3) a<-table.element(a,m.ct.i.tab[i,jjj]) a<-table.element(a,round(m.ct.i.tab[i,i]/sum(m.ct.i.tab[i,]),4)) for (jjj in 1:par3) a<-table.element(a,m.ct.x.tab[i,jjj]) a<-table.element(a,round(m.ct.x.tab[i,i]/sum(m.ct.x.tab[i,]),4)) a<-table.row.end(a) } a<-table.row.start(a) a<-table.element(a,'Overall',1,TRUE) for (jjj in 1:par3) a<-table.element(a,'-') a<-table.element(a,round(m.ct.i.cp,4)) for (jjj in 1:par3) a<-table.element(a,'-') a<-table.element(a,round(m.ct.x.cp,4)) a<-table.row.end(a) a<-table.end(a) table.save(a,file='mytable3.tab') } } m bitmap(file='test1.png') plot(m) dev.off() bitmap(file='test1a.png') plot(x[,par1] ~ as.factor(where(m)),main='Response by Terminal Node',xlab='Terminal Node',ylab='Response') dev.off() if (par2 == 'none') { forec <- predict(m) result <- as.data.frame(cbind(x[,par1],forec,x[,par1]-forec)) colnames(result) <- c('Actuals','Forecasts','Residuals') print(result) } if (par2 != 'none') { print(cbind(as.factor(x[,par1]),predict(m))) myt <- table(as.factor(x[,par1]),predict(m)) print(myt) } bitmap(file='test2.png') if(par2=='none') { op <- par(mfrow=c(2,2)) plot(density(result$Actuals),main='Kernel Density Plot of Actuals') plot(density(result$Residuals),main='Kernel Density Plot of Residuals') plot(result$Forecasts,result$Actuals,main='Actuals versus Predictions',xlab='Predictions',ylab='Actuals') plot(density(result$Forecasts),main='Kernel Density Plot of Predictions') par(op) } if(par2!='none') { plot(myt,main='Confusion Matrix',xlab='Actual',ylab='Predicted') } dev.off() if (par2 == 'none') { detcoef <- cor(result$Forecasts,result$Actuals) a<-table.start() a<-table.row.start(a) a<-table.element(a,'Goodness of Fit',2,TRUE) a<-table.row.end(a) a<-table.row.start(a) a<-table.element(a,'Correlation',1,TRUE) a<-table.element(a,round(detcoef,4)) a<-table.row.end(a) a<-table.row.start(a) a<-table.element(a,'R-squared',1,TRUE) a<-table.element(a,round(detcoef*detcoef,4)) a<-table.row.end(a) a<-table.row.start(a) a<-table.element(a,'RMSE',1,TRUE) a<-table.element(a,round(sqrt(mean((result$Residuals)^2)),4)) a<-table.row.end(a) a<-table.end(a) table.save(a,file='mytable1.tab') a<-table.start() a<-table.row.start(a) a<-table.element(a,'Actuals, Predictions, and Residuals',4,TRUE) a<-table.row.end(a) a<-table.row.start(a) a<-table.element(a,'#',header=TRUE) a<-table.element(a,'Actuals',header=TRUE) a<-table.element(a,'Forecasts',header=TRUE) a<-table.element(a,'Residuals',header=TRUE) a<-table.row.end(a) for (i in 1:length(result$Actuals)) { a<-table.row.start(a) a<-table.element(a,i,header=TRUE) a<-table.element(a,result$Actuals[i]) a<-table.element(a,result$Forecasts[i]) a<-table.element(a,result$Residuals[i]) a<-table.row.end(a) } a<-table.end(a) table.save(a,file='mytable.tab') } if (par2 != 'none') { a<-table.start() a<-table.row.start(a) a<-table.element(a,'Confusion Matrix (predicted in columns / actuals in rows)',par3+1,TRUE) a<-table.row.end(a) a<-table.row.start(a) a<-table.element(a,'',1,TRUE) for (i in 1:par3) { a<-table.element(a,paste('C',i,sep=''),1,TRUE) } a<-table.row.end(a) for (i in 1:par3) { a<-table.row.start(a) a<-table.element(a,paste('C',i,sep=''),1,TRUE) for (j in 1:par3) { a<-table.element(a,myt[i,j]) } a<-table.row.end(a) } a<-table.end(a) table.save(a,file='mytable2.tab') } | ||||||||||||||||||||||||||||||||||||||||||||||||||||||||||||||||||||||||||||||||||||||||||||||||||||||||||||||||||||||||||||||||||||||||||||||||||||||||||||||||||||||||||||||||||||||||||||||||||||||||||||||||||||||||||||||||||||||||||||||||||||||||||||||||||||||||||||||||||||||||||||||||||||||||||||||||||||||||||||||||||||||||||||||||||||||||||||||||||||||||||||||||||||||||||||||||||||||||||||||||||||||||||||||||||||||||||||||||||||||||||||||||||||||||||||||||||||||||||||||||||||||||||||||||||||||||||||||||||||||||||||||||||||||||||||||||||||||
Copyright

This work is licensed under a
Creative Commons Attribution-Noncommercial-Share Alike 3.0 License.
Software written by Ed van Stee & Patrick Wessa
Disclaimer
Information provided on this web site is provided "AS IS" without warranty of any kind, either express or implied, including, without limitation, warranties of merchantability, fitness for a particular purpose, and noninfringement. We use reasonable efforts to include accurate and timely information and periodically update the information, and software without notice. However, we make no warranties or representations as to the accuracy or completeness of such information (or software), and we assume no liability or responsibility for errors or omissions in the content of this web site, or any software bugs in online applications. Your use of this web site is AT YOUR OWN RISK. Under no circumstances and under no legal theory shall we be liable to you or any other person for any direct, indirect, special, incidental, exemplary, or consequential damages arising from your access to, or use of, this web site.
Privacy Policy
We may request personal information to be submitted to our servers in order to be able to:
- personalize online software applications according to your needs
- enforce strict security rules with respect to the data that you upload (e.g. statistical data)
- manage user sessions of online applications
- alert you about important changes or upgrades in resources or applications
We NEVER allow other companies to directly offer registered users information about their products and services. Banner references and hyperlinks of third parties NEVER contain any personal data of the visitor.
We do NOT sell, nor transmit by any means, personal information, nor statistical data series uploaded by you to third parties.
We carefully protect your data from loss, misuse, alteration,
and destruction. However, at any time, and under any circumstance you
are solely responsible for managing your passwords, and keeping them
secret.
We store a unique ANONYMOUS USER ID in the form of a small 'Cookie' on your computer. This allows us to track your progress when using this website which is necessary to create state-dependent features. The cookie is used for NO OTHER PURPOSE. At any time you may opt to disallow cookies from this website - this will not affect other features of this website.
We examine cookies that are used by third-parties (banner and online ads) very closely: abuse from third-parties automatically results in termination of the advertising contract without refund. We have very good reason to believe that the cookies that are produced by third parties (banner ads) do NOT cause any privacy or security risk.
FreeStatistics.org is safe. There is no need to download any software to use the applications and services contained in this website. Hence, your system's security is not compromised by their use, and your personal data - other than data you submit in the account application form, and the user-agent information that is transmitted by your browser - is never transmitted to our servers.
As a general rule, we do not log on-line behavior of individuals (other than normal logging of webserver 'hits'). However, in cases of abuse, hacking, unauthorized access, Denial of Service attacks, illegal copying, hotlinking, non-compliance with international webstandards (such as robots.txt), or any other harmful behavior, our system engineers are empowered to log, track, identify, publish, and ban misbehaving individuals - even if this leads to ban entire blocks of IP addresses, or disclosing user's identity.