workshop 8 | |||||||||||||||||||||||||||||||||||||||||||||||||||||||||||||||||||||||||||||||||||||||||||||||||||||||||||||||||||||||||||
| *The author of this computation has been verified* | |||||||||||||||||||||||||||||||||||||||||||||||||||||||||||||||||||||||||||||||||||||||||||||||||||||||||||||||||||||||||||
| R Software Module: /rwasp_smp.wasp (opens new window with default values) | |||||||||||||||||||||||||||||||||||||||||||||||||||||||||||||||||||||||||||||||||||||||||||||||||||||||||||||||||||||||||||
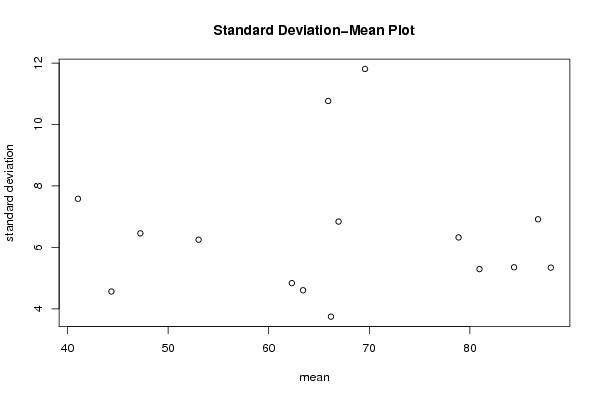
| Title produced by software: Standard Deviation-Mean Plot | |||||||||||||||||||||||||||||||||||||||||||||||||||||||||||||||||||||||||||||||||||||||||||||||||||||||||||||||||||||||||||
| Date of computation: Thu, 26 Nov 2009 13:14:23 -0700 | |||||||||||||||||||||||||||||||||||||||||||||||||||||||||||||||||||||||||||||||||||||||||||||||||||||||||||||||||||||||||||
| Cite this page as follows: | |||||||||||||||||||||||||||||||||||||||||||||||||||||||||||||||||||||||||||||||||||||||||||||||||||||||||||||||||||||||||||
| Statistical Computations at FreeStatistics.org, Office for Research Development and Education, URL http://www.freestatistics.org/blog/date/2009/Nov/26/t1259266508jzv5sn186egp3kb.htm/, Retrieved Thu, 26 Nov 2009 21:15:10 +0100 | |||||||||||||||||||||||||||||||||||||||||||||||||||||||||||||||||||||||||||||||||||||||||||||||||||||||||||||||||||||||||||
| BibTeX entries for LaTeX users: | |||||||||||||||||||||||||||||||||||||||||||||||||||||||||||||||||||||||||||||||||||||||||||||||||||||||||||||||||||||||||||
@Manual{KEY,
    author = {{YOUR NAME}},
    publisher = {Office for Research Development and Education},
    title = {Statistical Computations at FreeStatistics.org, URL http://www.freestatistics.org/blog/date/2009/Nov/26/t1259266508jzv5sn186egp3kb.htm/},
    year = {2009},
}
@Manual{R,
    title = {R: A Language and Environment for Statistical Computing},
    author = {{R Development Core Team}},
    organization = {R Foundation for Statistical Computing},
    address = {Vienna, Austria},
    year = {2009},
    note = {{ISBN} 3-900051-07-0},
    url = {http://www.R-project.org},
}
| |||||||||||||||||||||||||||||||||||||||||||||||||||||||||||||||||||||||||||||||||||||||||||||||||||||||||||||||||||||||||||
| Original text written by user: | |||||||||||||||||||||||||||||||||||||||||||||||||||||||||||||||||||||||||||||||||||||||||||||||||||||||||||||||||||||||||||
| IsPrivate? | |||||||||||||||||||||||||||||||||||||||||||||||||||||||||||||||||||||||||||||||||||||||||||||||||||||||||||||||||||||||||||
| No (this computation is public) | |||||||||||||||||||||||||||||||||||||||||||||||||||||||||||||||||||||||||||||||||||||||||||||||||||||||||||||||||||||||||||
| User-defined keywords: | |||||||||||||||||||||||||||||||||||||||||||||||||||||||||||||||||||||||||||||||||||||||||||||||||||||||||||||||||||||||||||
| Dataseries X: | |||||||||||||||||||||||||||||||||||||||||||||||||||||||||||||||||||||||||||||||||||||||||||||||||||||||||||||||||||||||||||
| » Textbox « » Textfile « » CSV « | |||||||||||||||||||||||||||||||||||||||||||||||||||||||||||||||||||||||||||||||||||||||||||||||||||||||||||||||||||||||||||
| 44.58070218 43.3193912 42.07587125 40.8501513 39.64224047 39.64224047 45.85979536 52.5216938 53.90730164 53.90730164 53.90730164 56.73168085 59.62689273 59.62689273 59.62689273 58.17043656 58.17043656 59.62689273 67.17441874 78.48233794 81.87175216 83.59285653 83.59285653 85.33155061 87.08782811 87.08782811 85.33155061 83.59285653 81.87175216 80.16824383 85.33155061 96.13275234 96.13275234 94.2886494 90.65310867 88.86168284 88.86168284 87.08782811 83.59285653 80.16824383 76.81404097 75.16335947 83.59285653 92.46209953 96.13275234 94.2886494 92.46209953 90.65310867 92.46209953 90.65310867 87.08782811 83.59285653 78.48233794 75.16335947 80.16824383 88.86168284 88.86168284 85.33155061 81.87175216 80.16824383 78.48233794 78.48233794 75.16335947 71.91486948 70.31707448 70.31707448 76.81404097 87.08782811 88.86168284 85.33155061 81.87175216 81.87175216 83.59285653 81.87175216 80.16824383 78.48233794 75.16335947 73.53030008 78.48233794 88 etc... | |||||||||||||||||||||||||||||||||||||||||||||||||||||||||||||||||||||||||||||||||||||||||||||||||||||||||||||||||||||||||||
| Output produced by software: | |||||||||||||||||||||||||||||||||||||||||||||||||||||||||||||||||||||||||||||||||||||||||||||||||||||||||||||||||||||||||||
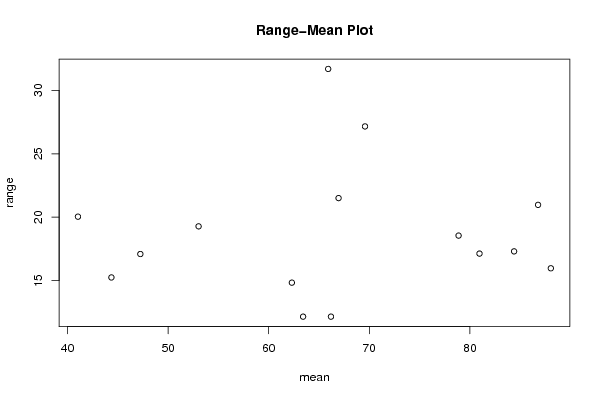
| Charts produced by software: |
| Parameters (Session): | par1 = 1 ; par2 = 0 ; par3 = 1 ; par4 = 12 ; | | Parameters (R input): | par1 = 12 ; par2 = 0 ; par3 = 1 ; par4 = 12 ; | | R code (references can be found in the software module): | par1 <- as.numeric(par1)
| (n <- length(x)) (np <- floor(n / par1)) arr <- array(NA,dim=c(par1,np)) j <- 0 k <- 1 for (i in 1:(np*par1)) { j = j + 1 arr[j,k] <- x[i] if (j == par1) { j = 0 k=k+1 } } arr arr.mean <- array(NA,dim=np) arr.sd <- array(NA,dim=np) arr.range <- array(NA,dim=np) for (j in 1:np) { arr.mean[j] <- mean(arr[,j],na.rm=TRUE) arr.sd[j] <- sd(arr[,j],na.rm=TRUE) arr.range[j] <- max(arr[,j],na.rm=TRUE) - min(arr[,j],na.rm=TRUE) } arr.mean arr.sd arr.range (lm1 <- lm(arr.sd~arr.mean)) (lnlm1 <- lm(log(arr.sd)~log(arr.mean))) (lm2 <- lm(arr.range~arr.mean)) bitmap(file='test1.png') plot(arr.mean,arr.sd,main='Standard Deviation-Mean Plot',xlab='mean',ylab='standard deviation') dev.off() bitmap(file='test2.png') plot(arr.mean,arr.range,main='Range-Mean Plot',xlab='mean',ylab='range') dev.off() load(file='createtable') a<-table.start() a<-table.row.start(a) a<-table.element(a,'Standard Deviation-Mean Plot',4,TRUE) a<-table.row.end(a) a<-table.row.start(a) a<-table.element(a,'Section',header=TRUE) a<-table.element(a,'Mean',header=TRUE) a<-table.element(a,'Standard Deviation',header=TRUE) a<-table.element(a,'Range',header=TRUE) a<-table.row.end(a) for (j in 1:np) { a<-table.row.start(a) a<-table.element(a,j,header=TRUE) a<-table.element(a,arr.mean[j]) a<-table.element(a,arr.sd[j] ) a<-table.element(a,arr.range[j] ) a<-table.row.end(a) } a<-table.end(a) table.save(a,file='mytable.tab') a<-table.start() a<-table.row.start(a) a<-table.element(a,'Regression: S.E.(k) = alpha + beta * Mean(k)',2,TRUE) a<-table.row.end(a) a<-table.row.start(a) a<-table.element(a,'alpha',header=TRUE) a<-table.element(a,lm1$coefficients[[1]]) a<-table.row.end(a) a<-table.row.start(a) a<-table.element(a,'beta',header=TRUE) a<-table.element(a,lm1$coefficients[[2]]) a<-table.row.end(a) a<-table.row.start(a) a<-table.element(a,'S.D.',header=TRUE) a<-table.element(a,summary(lm1)$coefficients[2,2]) a<-table.row.end(a) a<-table.row.start(a) a<-table.element(a,'T-STAT',header=TRUE) a<-table.element(a,summary(lm1)$coefficients[2,3]) a<-table.row.end(a) a<-table.row.start(a) a<-table.element(a,'p-value',header=TRUE) a<-table.element(a,summary(lm1)$coefficients[2,4]) a<-table.row.end(a) a<-table.end(a) table.save(a,file='mytable1.tab') a<-table.start() a<-table.row.start(a) a<-table.element(a,'Regression: ln S.E.(k) = alpha + beta * ln Mean(k)',2,TRUE) a<-table.row.end(a) a<-table.row.start(a) a<-table.element(a,'alpha',header=TRUE) a<-table.element(a,lnlm1$coefficients[[1]]) a<-table.row.end(a) a<-table.row.start(a) a<-table.element(a,'beta',header=TRUE) a<-table.element(a,lnlm1$coefficients[[2]]) a<-table.row.end(a) a<-table.row.start(a) a<-table.element(a,'S.D.',header=TRUE) a<-table.element(a,summary(lnlm1)$coefficients[2,2]) a<-table.row.end(a) a<-table.row.start(a) a<-table.element(a,'T-STAT',header=TRUE) a<-table.element(a,summary(lnlm1)$coefficients[2,3]) a<-table.row.end(a) a<-table.row.start(a) a<-table.element(a,'p-value',header=TRUE) a<-table.element(a,summary(lnlm1)$coefficients[2,4]) a<-table.row.end(a) a<-table.row.start(a) a<-table.element(a,'Lambda',header=TRUE) a<-table.element(a,1-lnlm1$coefficients[[2]]) a<-table.row.end(a) a<-table.end(a) table.save(a,file='mytable2.tab') | Copyright
Software written by Ed van Stee & Patrick Wessa Disclaimer Information provided on this web site is provided "AS IS" without warranty of any kind, either express or implied, including, without limitation, warranties of merchantability, fitness for a particular purpose, and noninfringement. We use reasonable efforts to include accurate and timely information and periodically update the information, and software without notice. However, we make no warranties or representations as to the accuracy or completeness of such information (or software), and we assume no liability or responsibility for errors or omissions in the content of this web site, or any software bugs in online applications. Your use of this web site is AT YOUR OWN RISK. Under no circumstances and under no legal theory shall we be liable to you or any other person for any direct, indirect, special, incidental, exemplary, or consequential damages arising from your access to, or use of, this web site. Privacy Policy We may request personal information to be submitted to our servers in order to be able to:
We NEVER allow other companies to directly offer registered users information about their products and services. Banner references and hyperlinks of third parties NEVER contain any personal data of the visitor. We do NOT sell, nor transmit by any means, personal information, nor statistical data series uploaded by you to third parties.
We store a unique ANONYMOUS USER ID in the form of a small 'Cookie' on your computer. This allows us to track your progress when using this website which is necessary to create state-dependent features. The cookie is used for NO OTHER PURPOSE. At any time you may opt to disallow cookies from this website - this will not affect other features of this website. We examine cookies that are used by third-parties (banner and online ads) very closely: abuse from third-parties automatically results in termination of the advertising contract without refund. We have very good reason to believe that the cookies that are produced by third parties (banner ads) do NOT cause any privacy or security risk. FreeStatistics.org is safe. There is no need to download any software to use the applications and services contained in this website. Hence, your system's security is not compromised by their use, and your personal data - other than data you submit in the account application form, and the user-agent information that is transmitted by your browser - is never transmitted to our servers. As a general rule, we do not log on-line behavior of individuals (other than normal logging of webserver 'hits'). However, in cases of abuse, hacking, unauthorized access, Denial of Service attacks, illegal copying, hotlinking, non-compliance with international webstandards (such as robots.txt), or any other harmful behavior, our system engineers are empowered to log, track, identify, publish, and ban misbehaving individuals - even if this leads to ban entire blocks of IP addresses, or disclosing user's identity. | |||||||||||||||||||||||||||||||||||||||||||||||||||||||||||||||||||||||||||||||||||||||||||||||||||||||||||||||