| *The author of this computation has been verified* | ||||||||||||||||||||||||||||||||||||||||||||
| R Software Module: /rwasp_boxcoxlin.wasp (opens new window with default values) | ||||||||||||||||||||||||||||||||||||||||||||
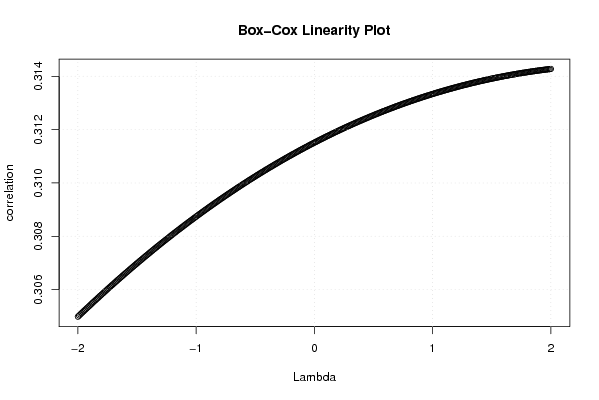
| Title produced by software: Box-Cox Linearity Plot | ||||||||||||||||||||||||||||||||||||||||||||
| Date of computation: Fri, 13 Nov 2009 06:56:54 -0700 | ||||||||||||||||||||||||||||||||||||||||||||
| Cite this page as follows: | ||||||||||||||||||||||||||||||||||||||||||||
| Statistical Computations at FreeStatistics.org, Office for Research Development and Education, URL http://www.freestatistics.org/blog/date/2009/Nov/13/t1258120697h0gy44l6qglu51y.htm/, Retrieved Fri, 13 Nov 2009 14:58:24 +0100 | ||||||||||||||||||||||||||||||||||||||||||||
| BibTeX entries for LaTeX users: | ||||||||||||||||||||||||||||||||||||||||||||
@Manual{KEY,
    author = {{YOUR NAME}},
    publisher = {Office for Research Development and Education},
    title = {Statistical Computations at FreeStatistics.org, URL http://www.freestatistics.org/blog/date/2009/Nov/13/t1258120697h0gy44l6qglu51y.htm/},
    year = {2009},
}
@Manual{R,
    title = {R: A Language and Environment for Statistical Computing},
    author = {{R Development Core Team}},
    organization = {R Foundation for Statistical Computing},
    address = {Vienna, Austria},
    year = {2009},
    note = {{ISBN} 3-900051-07-0},
    url = {http://www.R-project.org},
}
| ||||||||||||||||||||||||||||||||||||||||||||
| Original text written by user: | ||||||||||||||||||||||||||||||||||||||||||||
| IsPrivate? | ||||||||||||||||||||||||||||||||||||||||||||
| No (this computation is public) | ||||||||||||||||||||||||||||||||||||||||||||
| User-defined keywords: | ||||||||||||||||||||||||||||||||||||||||||||
| Dataseries X: | ||||||||||||||||||||||||||||||||||||||||||||
| » Textbox « » Textfile « » CSV « | ||||||||||||||||||||||||||||||||||||||||||||
| 100 96,66958808 91,06047327 89,04469763 82,90972831 84,04907975 91,76161262 90,09640666 85,97721297 99,82471516 70,90271691 83,87379492 99,21121823 92,81332165 95,3549518 89,65819457 86,76599474 88,25591586 101,2269939 88,25591586 96,3190184 100,4382121 74,84662577 88,08063103 100,6134969 102,1034181 98,94829097 89,39526731 92,90096407 92,28746713 104,1191937 92,98860649 95,79316389 102,716915 81,06923751 91,32340053 98,5977213 107,2743208 99,29886065 87,64241893 97,02015776 98,86064855 96,23137599 102,8045574 95,61787905 101,5775635 84,13672217 87,46713409 102,3663453 101,4022787 87,11656442 82,64680105 79,75460123 81,68273444 90,35933392 82,47151621 80,45574058 90,00876424 72,39263804 78,08939527 | ||||||||||||||||||||||||||||||||||||||||||||
| Dataseries Y: | ||||||||||||||||||||||||||||||||||||||||||||
| » Textbox « » Textfile « » CSV « | ||||||||||||||||||||||||||||||||||||||||||||
| 100 111,8629088 94,1225572 67,79436315 146,0424236 125,6555043 142,8655602 130,0304429 110,0117843 132,789944 88,23529412 91,96700383 96,65128155 97,14720613 90,7345576 52,52872434 156,9085731 144,8787194 169,4294412 133,3840715 131,2776196 116,32623 89,15349111 85,08298144 89,38917804 103,0884808 85,34812923 45,9933222 152,823333 130,3692429 150,5008347 126,971423 123,2446234 126,5737013 100,2553275 91,76077777 100,2847884 121,6537366 97,28960031 62,54541884 154,9936168 147,8493568 147,3976235 156,8005499 126,8093882 131,7637239 99,20946676 87,34655799 100,7561622 110,5666307 76,46076795 56,51085142 124,9484435 118,2853776 136,4332711 128,6212315 100,7365217 111,7499754 93,43022685 83,3300599 | ||||||||||||||||||||||||||||||||||||||||||||
| Output produced by software: | ||||||||||||||||||||||||||||||||||||||||||||
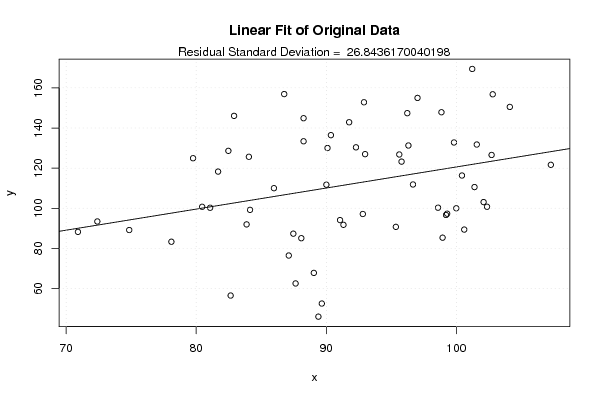
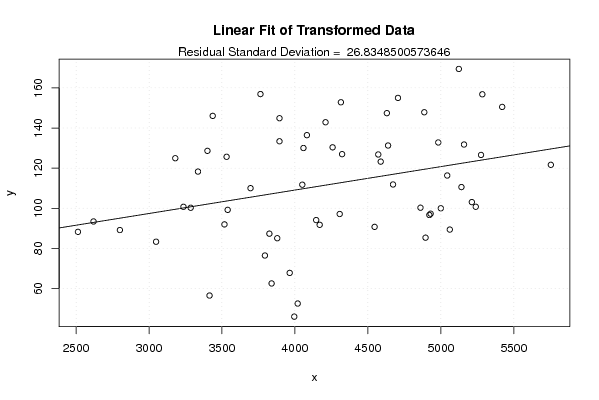
| Charts produced by software: |
| Parameters (Session): | | Parameters (R input): | | R code (references can be found in the software module): | n <- length(x)
| c <- array(NA,dim=c(401)) l <- array(NA,dim=c(401)) mx <- 0 mxli <- -999 for (i in 1:401) { l[i] <- (i-201)/100 if (l[i] != 0) { x1 <- (x^l[i] - 1) / l[i] } else { x1 <- log(x) } c[i] <- cor(x1,y) if (mx < abs(c[i])) { mx <- abs(c[i]) mxli <- l[i] } } c mx mxli if (mxli != 0) { x1 <- (x^mxli - 1) / mxli } else { x1 <- log(x) } r<-lm(y~x) se <- sqrt(var(r$residuals)) r1 <- lm(y~x1) se1 <- sqrt(var(r1$residuals)) bitmap(file='test1.png') plot(l,c,main='Box-Cox Linearity Plot',xlab='Lambda',ylab='correlation') grid() dev.off() bitmap(file='test2.png') plot(x,y,main='Linear Fit of Original Data',xlab='x',ylab='y') abline(r) grid() mtext(paste('Residual Standard Deviation = ',se)) dev.off() bitmap(file='test3.png') plot(x1,y,main='Linear Fit of Transformed Data',xlab='x',ylab='y') abline(r1) grid() mtext(paste('Residual Standard Deviation = ',se1)) dev.off() load(file='createtable') a<-table.start() a<-table.row.start(a) a<-table.element(a,'Box-Cox Linearity Plot',2,TRUE) a<-table.row.end(a) a<-table.row.start(a) a<-table.element(a,'# observations x',header=TRUE) a<-table.element(a,n) a<-table.row.end(a) a<-table.row.start(a) a<-table.element(a,'maximum correlation',header=TRUE) a<-table.element(a,mx) a<-table.row.end(a) a<-table.row.start(a) a<-table.element(a,'optimal lambda(x)',header=TRUE) a<-table.element(a,mxli) a<-table.row.end(a) a<-table.row.start(a) a<-table.element(a,'Residual SD (orginial)',header=TRUE) a<-table.element(a,se) a<-table.row.end(a) a<-table.row.start(a) a<-table.element(a,'Residual SD (transformed)',header=TRUE) a<-table.element(a,se1) a<-table.row.end(a) a<-table.end(a) table.save(a,file='mytable.tab') | Copyright
Software written by Ed van Stee & Patrick Wessa Disclaimer Information provided on this web site is provided "AS IS" without warranty of any kind, either express or implied, including, without limitation, warranties of merchantability, fitness for a particular purpose, and noninfringement. We use reasonable efforts to include accurate and timely information and periodically update the information, and software without notice. However, we make no warranties or representations as to the accuracy or completeness of such information (or software), and we assume no liability or responsibility for errors or omissions in the content of this web site, or any software bugs in online applications. Your use of this web site is AT YOUR OWN RISK. Under no circumstances and under no legal theory shall we be liable to you or any other person for any direct, indirect, special, incidental, exemplary, or consequential damages arising from your access to, or use of, this web site. Privacy Policy We may request personal information to be submitted to our servers in order to be able to:
We NEVER allow other companies to directly offer registered users information about their products and services. Banner references and hyperlinks of third parties NEVER contain any personal data of the visitor. We do NOT sell, nor transmit by any means, personal information, nor statistical data series uploaded by you to third parties.
We store a unique ANONYMOUS USER ID in the form of a small 'Cookie' on your computer. This allows us to track your progress when using this website which is necessary to create state-dependent features. The cookie is used for NO OTHER PURPOSE. At any time you may opt to disallow cookies from this website - this will not affect other features of this website. We examine cookies that are used by third-parties (banner and online ads) very closely: abuse from third-parties automatically results in termination of the advertising contract without refund. We have very good reason to believe that the cookies that are produced by third parties (banner ads) do NOT cause any privacy or security risk. FreeStatistics.org is safe. There is no need to download any software to use the applications and services contained in this website. Hence, your system's security is not compromised by their use, and your personal data - other than data you submit in the account application form, and the user-agent information that is transmitted by your browser - is never transmitted to our servers. As a general rule, we do not log on-line behavior of individuals (other than normal logging of webserver 'hits'). However, in cases of abuse, hacking, unauthorized access, Denial of Service attacks, illegal copying, hotlinking, non-compliance with international webstandards (such as robots.txt), or any other harmful behavior, our system engineers are empowered to log, track, identify, publish, and ban misbehaving individuals - even if this leads to ban entire blocks of IP addresses, or disclosing user's identity. | ||||||||||||||||||||||||||||||||||